| MWI(0) | 46 | kDa |
| MWexpected | 41 | kDa |
| VPorod | 68 | nm3 |
|
log I(s)
1.62×100
1.62×10⁻¹
1.62×10⁻²
1.62×10⁻³
|
 s, nm-1
|
|
|
|

|
|

|
|

|
|

|
|
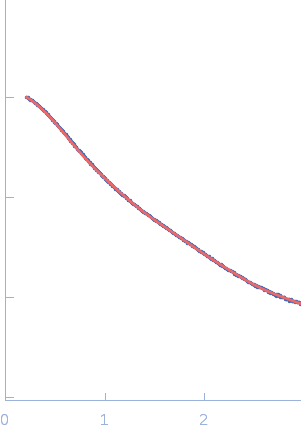
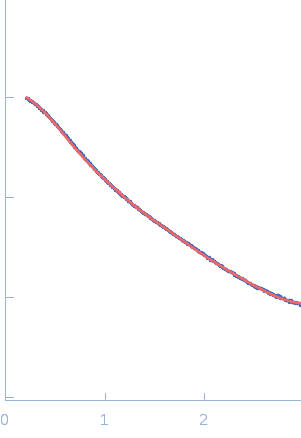
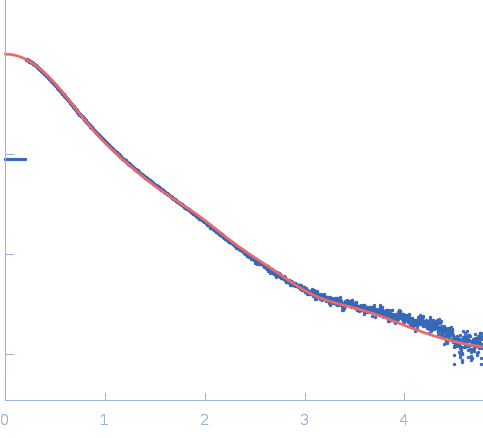
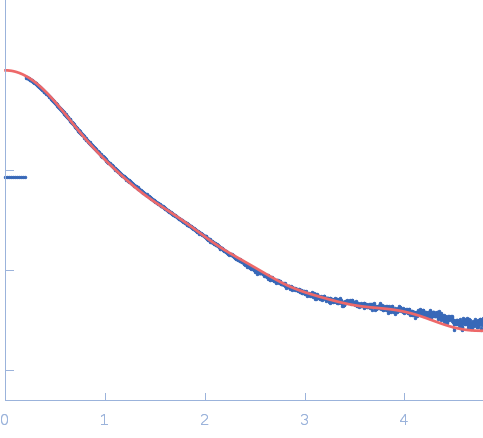
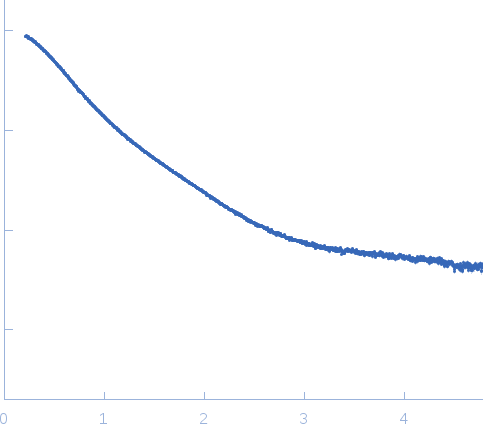
Synchrotron SAXS
data from solutions of
fH1015
in
50 mM Potassium Phosphate, pH 7.4
were collected
on the
EMBL X33 beam line
at the DORIS III, DESY storage ring
(Hamburg, Germany)
using a MAR 345 Image Plate detector
(I(s) vs s, where s = 4πsinθ/λ, and 2θ is the scattering angle).
Solute concentrations ranging between 2.4 and 10.5 mg/ml were measured
at 10°C.
One
120 second frame was collected.
The data were normalized to the intensity of the transmitted beam and radially averaged; the scattering of the solvent-blank was subtracted.
The low angle data collected at lower concentration were merged with the highest concentration high angle data to yield the final composite scattering curve.
Wavelength = UNKNOWN. Sample detector distance = UNKNOWN
Tags:
X33
|
|
|||||||||||||||||||||