The C-terminal region of the human p23 chaperone modulates its structure and function.

Seraphim TV, Gava LM, Mokry DZ, Cagliari TC, Barbosa LR, Ramos CH, Borges JC, Arch Biochem Biophys 565:57-67 (2015) Europe PMC

SASDBH6 – Full-length human p23 (1-160)

Prostaglandin E synthase 3
MWexperimental 21 kDa
MWexpected 19 kDa
VPorod 40 nm3
log I(s) 1.90×10⁻² 1.90×10⁻³ 1.90×10⁻⁴ 1.90×10⁻⁵
Prostaglandin E synthase 3 small angle scattering data  s, nm-1
ln I(s)
Prostaglandin E synthase 3 Guinier plot ln 1.90×10⁻² Rg: 2.5 nm 0 (2.5 nm)-2 s2
(sRg)2I(s)/I(0)
Prostaglandin E synthase 3 Kratky plot 1.104 0 3 sRg
p(r)
Prostaglandin E synthase 3 pair distance distribution function Rg: 2.7 nm 0 Dmax: 10 nm

Data validation


There are no models related to this curve.

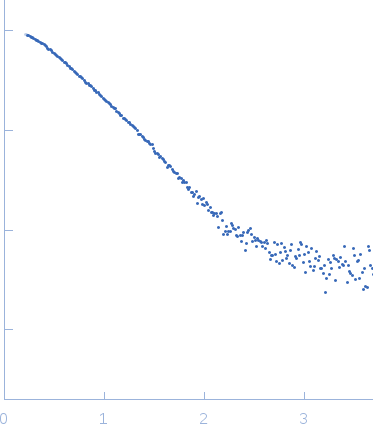
Synchrotron SAXS data from solutions of full-length human p23 in 25 mM Tris-HCl, 100 mM NaCl, 5 mM β-mercaptoethanol, pH 7.5, were collected on the SAXS1 Beamline at the Brazilian Synchrotron Light Laboratory (Campinas, Brazil) using a 20Hz Pilatus 300K detector at a sample-detector distance of 1 m and at a wavelength of λ = 0.1488 nm (I(s) vs s, where s = 4π sin θ/λ and 2θ is the scattering angle). Solute concentrations ranging between 1 and 2 mg/ml were measured at 20°C. Two successive 30 second frames were collected. The data were normalized to the intensity of the transmitted beam and radially averaged; the scattering of the solvent-blank was subtracted.

Samples were measured at 1 mg/mL and 2 mg/mL in 1 mm path-length mica cells. 
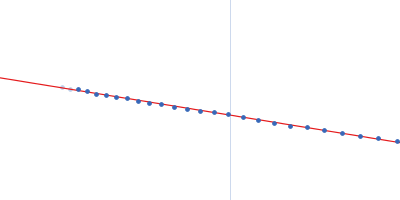
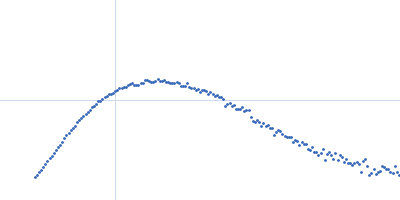
All curves were inspected for X-ray damage and aggregation. The experimental molecular weight was determined by analytical ultracentrifugation.

Prostaglandin E synthase 3 (PTGES, Sba1, p23)
Mol. type   Protein
Organism   Homo sapiens
Olig. state   Monomer
Mon. MW   18.8 kDa
 
UniProt   Q15185 (1-160)
Sequence   FASTA