|
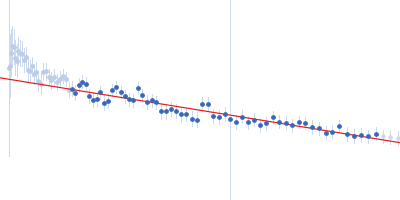
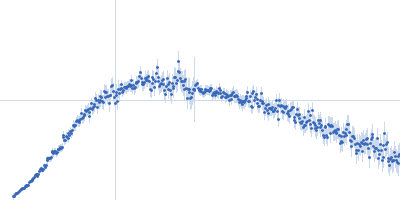
Synchrotron SAXS data from solutions of Colicin N WT in 50 mM Na-Phosphate 300 mM NaCl, pH 7.6 were collected on the BM29 beam line at the ESRF (Grenoble, France) using a Pilatus 1M detector at a sample-detector distance of 2.9 m and at a wavelength of λ = 0.15 nm (I(s) vs s, where s = 4πsinθ/λ and 2θ is the scattering angle). Solute concentrations ranging between 0.5 and 5.2 mg/ml were measured at 4°C. 10 successive 2 second frames were collected. The data were normalized to the intensity of the transmitted beam and radially averaged; the scattering of the solvent-blank was subtracted and the different curves were scaled for protein concentration. The low angle data collected at lower concentration were merged with the highest concentration high angle data to yield the final composite scattering curve.
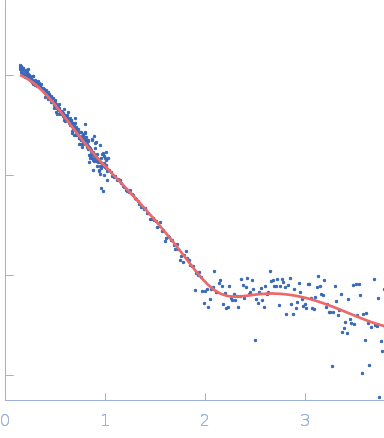
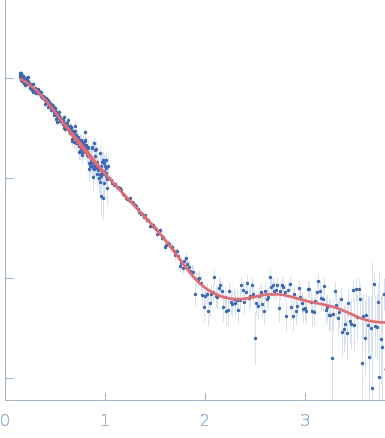
The results obtained from the bayesapp estimation of distribution functions from small-angle scattering data (http://www.bayesapp.org/) are included in the full entry zip archive.
|
|
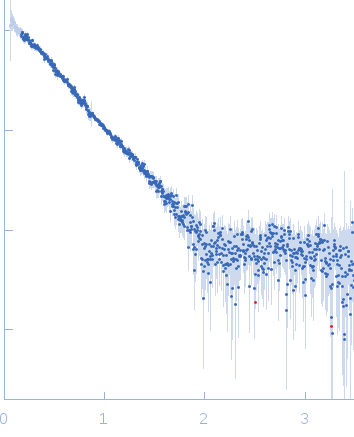 s, nm-1
 Rg, nm