A structural and biochemical comparison of Ribonuclease E homologues from pathogenic bacteria highlights species-specific properties.

Mardle CE, Shakespeare TJ, Butt LE, Goddard LR, Gowers DM, Atkins HS, Vincent HA, Callaghan AJ, Sci Rep 9(1):7952 (2019) Europe PMC

SASDE52 – Ribonuclease E from Escherichia coli

Endoribonuclease E
MWexperimental 276 kDa
MWexpected 247 kDa
VPorod 468 nm3
log I(s) 4.44×10⁻² 4.44×10⁻³ 4.44×10⁻⁴ 4.44×10⁻⁵
Endoribonuclease E small angle scattering data  s, nm-1
ln I(s)
Endoribonuclease E Guinier plot ln 4.45×10⁻² Rg: 5.0 nm 0 (5.0 nm)-2 s2
(sRg)2I(s)/I(0)
Endoribonuclease E Kratky plot 1.104 0 3 sRg
p(r)
Endoribonuclease E pair distance distribution function Rg: 5.0 nm 0 Dmax: 16.1 nm

Data validation


Fits and models


log I(s)
 s, nm-1
Endoribonuclease E DAMFILT model

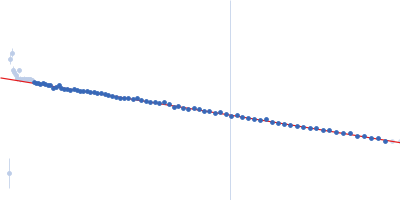
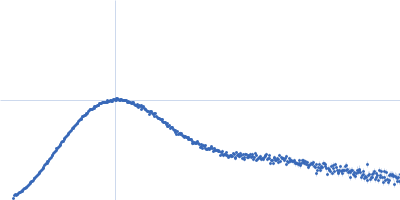
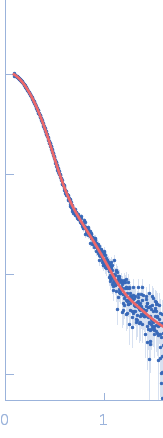
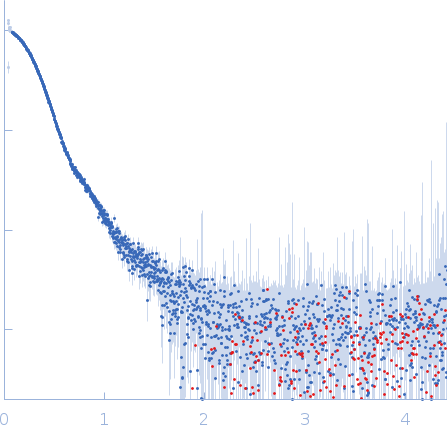
Synchrotron SAXS data from solutions of Ribonuclease E from Escherichia coli in 10 mM DTT, 10 mM MgCl2, 0.5 M NaCl, 20 mM Tris, pH 8 were collected on the B21 beam line at the Diamond Light Source (Oxfordshire, UK) using a Pilatus 2M detector at a sample-detector distance of 4.0 m and at a wavelength of λ = 0.1 nm (l(s) vs s, where s = 4πsinθ/λ, and 2θ is the scattering angle). One solute concentration of 6.58 mg/ml was measured at 15°C. 640 successive 3 second frames were collected. The data were normalized to the intensity of the transmitted beam and radially averaged; the scattering of the solvent-blank was subtracted.

Endoribonuclease E (RNase E)
Mol. type   Protein
Organism   Escherichia coli
Olig. state   Tetramer
Mon. MW   61.8 kDa
 
UniProt   P21513 (1-529)
Sequence   FASTA