|
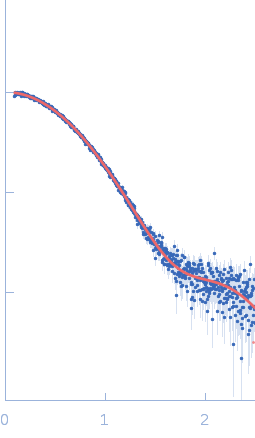
Synchrotron SAXS
data from solutions of
Insulin glulisine (Apidra), oligomeric composition
in
Apidra formulation (per ml: 5 mg Sodium chloride, 3.15 mg m-Cresol, 6 mg Trometamol, 0.01 mg Polysorbate 20), pH 7.3
were collected
on the
EMBL P12 beam line
at the PETRA III storage ring
(DESY; Hamburg, Germany)
using a Pilatus 2M detector
at a sample-detector distance of 3.1 m and
at a wavelength of λ = 0.1241 nm
(I(s) vs s, where s = 4πsinθ/λ, and 2θ is the scattering angle).
One solute concentration of 3.49 mg/ml was measured
at 20°C.
20 successive
0.045 second frames were collected.
The data were normalized to the intensity of the transmitted beam and radially averaged; the scattering of the solvent-blank was subtracted.
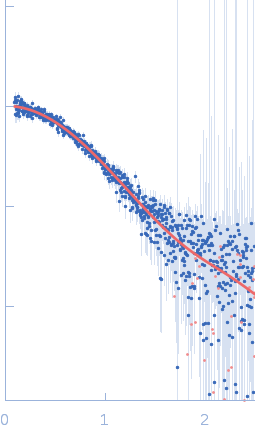
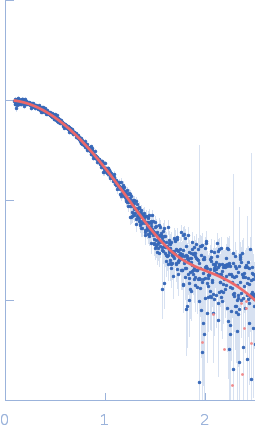
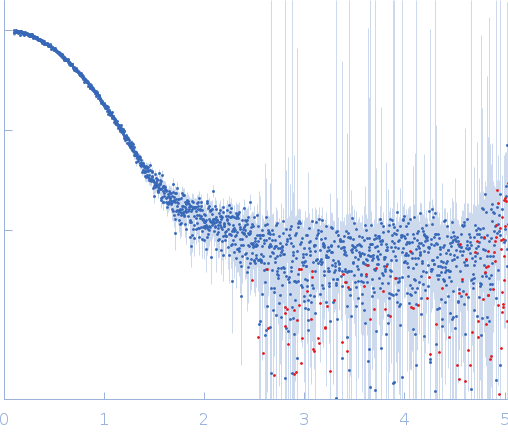
Here, Apidra measured at 3.49 mg/ml is displayed (formulation concentration).
Measurements from 2 dilutions in placebo have been deposited in addition. Mixture analysis of the scattering profiles was performed with the program Oligomer. The SAXS data show that Apidra® primarily consists of hexamers, which dissociate into monomers upon dilution. The presence of dimers was not required to fit the experimental data, and their volume fraction was always essentially zero. A small volume fraction is, however, also made up by larger dodecameric species. The distribution between monomer, dimer, hexamer and dodecamer is documented in the logfile. Calculation of the form factors is based on an internal model (Apidra.pdb) for hexamers and 3W80.pdb for dodecamers.
|
|
 s, nm-1