Visualizing disordered single-stranded RNA: connecting sequence, structure and electrostatics.

Plumridge A, Andresen K, Pollack L, J Am Chem Soc (2019) Europe PMC

SASDFB9 – Poly-adenosine rA30 in 100 mM NaCl

Poly-adenosine
MWexperimental 14 kDa
MWexpected 10 kDa
VPorod 14 nm3
log I(s) 3.32×101 3.32×100 3.32×10⁻¹ 3.32×10⁻²
Poly-adenosine small angle scattering data  s, nm-1
ln I(s)
Poly-adenosine Guinier plot ln 3.33×101 Rg: 2.4 nm 0 (2.4 nm)-2 s2
(sRg)2I(s)/I(0)
Poly-adenosine Kratky plot 1.104 0 3 sRg
p(r)
Poly-adenosine pair distance distribution function Rg: 2.6 nm 0 Dmax: 10.7 nm

Data validation


Fits and models


log I(s)
 s, nm-1
Poly-adenosine CUSTOM IN-HOUSE model

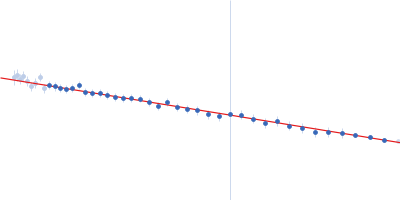
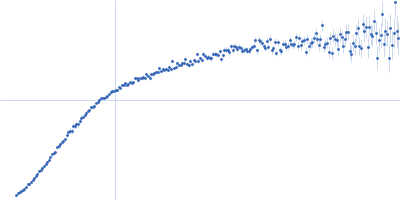
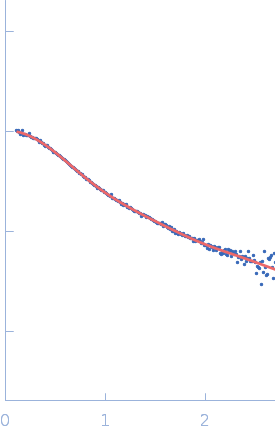
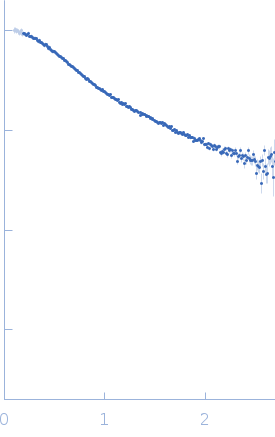
Synchrotron SAXS data from solutions of rA30 in 1 mM Na-MOPS, 100 mM NaCl, 20 µM EDTA, pH 7 were collected on the G1 beam line at the Cornell High Energy Synchrotron Source (CHESS) storage ring (Ithaca, NY, USA) using a Finger Lakes CCD detector at a sample-detector distance of 2.0 m and at a wavelength of λ = 0.11 nm (I(s) vs s, where s = 4πsinθ/λ, and 2θ is the scattering angle). Solute concentrations ranging between 0.4 and 1.2 mg/ml were measured at 25°C. 30 successive 10 second frames were collected. The data were normalized to the intensity of the transmitted beam and radially averaged; the scattering of the solvent-blank was subtracted. The low angle data collected at lower concentrations were extrapolated to infinite dilution and merged with the higher concentration data to yield the final composite scattering curve.

Poly-adenosine (rA30)
Mol. type   RNA
Olig. state   Monomer
Mon. MW   9.9 kDa
Sequence   FASTA