|
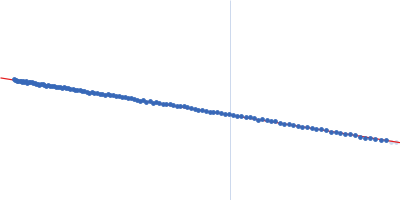
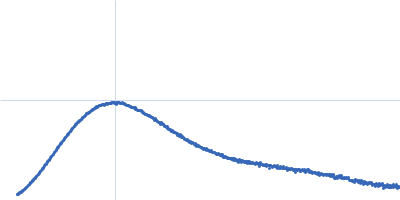
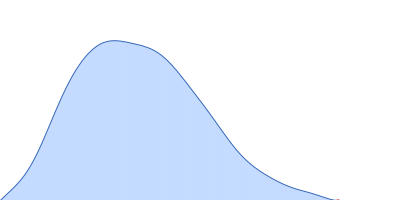
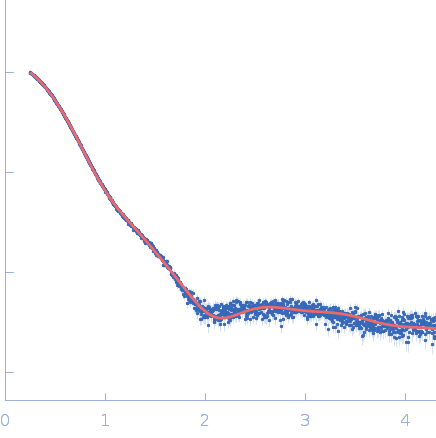
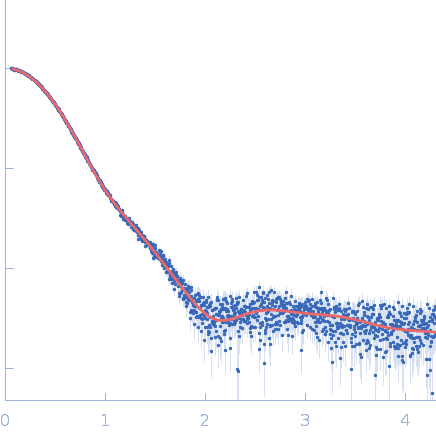
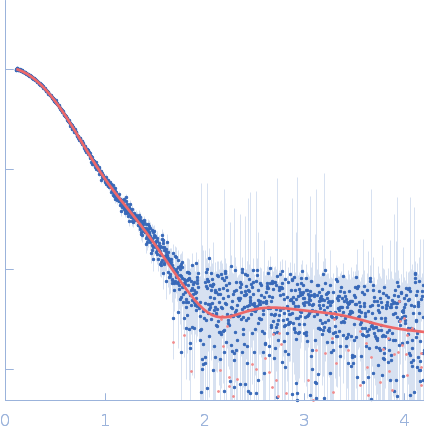
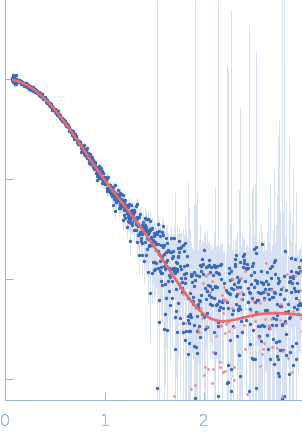
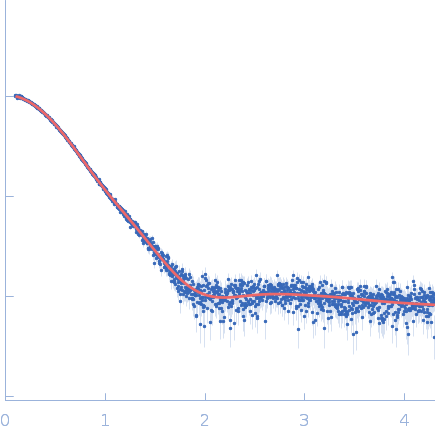
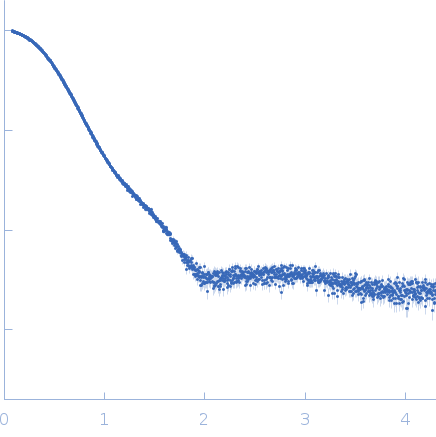
Synchrotron SAXS data were measured from recombinant Plasmodium falciparum lipocalin protein through a concentration series using a standard batch setup as well as in-line size-exclusion chromatography SAXS (SEC-SAXS). All samples were reconstituted in 20 mM Tris pH7.5, 150 mM NaCl, 5% v/v glycerol. The data were collected on the EMBL P12 beam line at PETRA III (Hamburg, Germany) equipped with Pilatus 6M detector at a sample-detector distance of 3 m and at a wavelength of λ = 0.124 nm (I(s) vs s, where s = 4πsinθ/λ, and 2θ is the scattering angle). For the batch measurements, the sample concentrations were: 10, 5, 2 and 1 mg/ml (20 successive 0.050 second frames were collected for each sample at 10°C, in addition to the corresponding matched solvent blank). The data were normalized to the intensity of the transmitted beam and radially averaged and the scattering of the solvent-blank was subtracted to generate the SAXS data displayed in this entry. The primary SAXS data displayed in this entry (top) and the corresponding structural parameters (Rg, p(r), normalized Kratky plot, etc) refer to the 10 mg/ml sample. The additional sample concentration data are represented by the tetramer-dimer equlibrium model fits to the data, and are made available in the full-entry zip-archive. The SEC-SAXS data (fit) is displayed at the bottom of the page. The SEC parameters were as follows: A 75 μl sample at 10 mg/ml was injected at a flow rate of 0.35 ml/min onto a GE Superdex 200 Increase 10/300 column at 20°C. 56 successive 1 second frames were collected through the major SEC-elution peak and processed using CHROMIXS that included the subtraction of an appropriate solvent blank measured from the protein-free column eluate. The Rg-correlation through the SEC-peak is included in the full-entry zip archive.
The models displayed in this entry fit the concentration series and SEC-SAXS data as a concentration-dependent tetramer-dimer equilibrium. The volume fraction of the tetramer decreases systematically as the sample concentration ins decreased, or via dilution through the SEC column (evaluated using SASREFmx in P222 (tetramer) P2 (dimer) symmery). The volume fractions of tetramer are: 10 mg/ml, 0.78; 5 mg/ml, 0.66; 2 mg/ml, 0.44; 1 mg/ml, 0.24 and for SEC, 0.15. Additional SASREFmx models, and their associated volume fractions (that do not differ significantly to the models and volume fractions reported here) are included in the full-entry zip archive.
|
|
 s, nm-1