| MWI(0) | 19 | kDa |
| MWexpected | 12 | kDa |
| VPorod | 15 | nm3 |
|
log I(s)
2.35×10⁻²
2.35×10⁻³
2.35×10⁻⁴
2.35×10⁻⁵
|
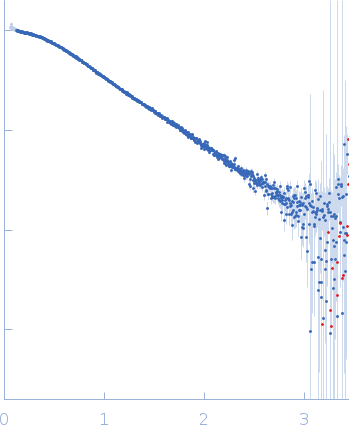 s, nm-1
|
|
|
|

|
|

|
|
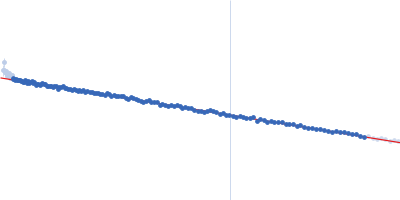
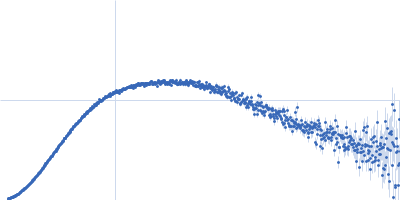
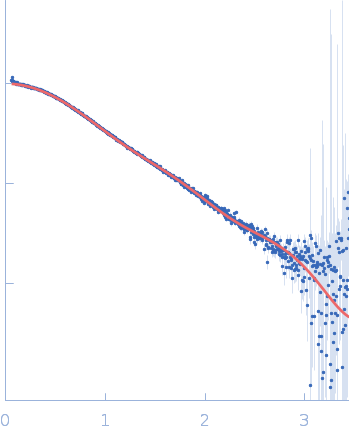
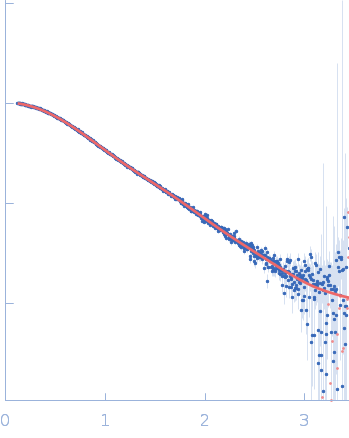
Synchrotron SAXS data from solutions of M100 oligonucleotide in 20 mM sodium phosphate buffer, 100 mM NaCl, 1 mM DTT, pH 7.4 were collected on the SAXS/WAXS beam line at the Australian Synchrotron (Melbourne, Australia) using a Pilatus 1M detector at a sample-detector distance of 0.9 m and at a wavelength of λ = 0.108 nm (I(s) vs s, where s = 4πsinθ/λ, and 2θ is the scattering angle). One solute concentration of 0.75 mg/ml was measured at 27°C. 32 successive 1 second frames were collected. The data were normalized to the intensity of the transmitted beam and radially averaged; the scattering of the solvent-blank was subtracted.
Storage temperature = UNKNOWN |
|
||||||||||||||||||