|
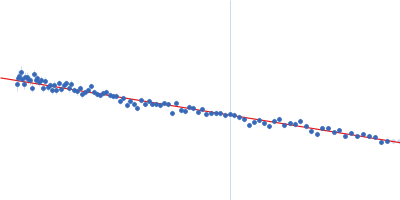
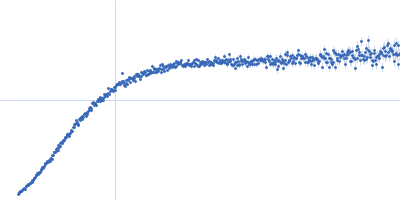
Synchrotron radiation small-angle X-ray scattering (SAXS) data were acquired for TIF2NRID at the P12 beam line of the European Molecular Biology Laboratory (EMBL) at the PETRA-III storage ring (Deutsches Elektronen-Synchrotron (DESY), Hamburg, Germany). The data were measured using a Pilatus 2M detector at a sample-to-detector distance of 3.1 m and a wavelength of λ = 0.124 nm (I(s) vs s, where s = 4πsinθ/λ, and 2θ is the scattering angle), through a momentum transfer range of 0.026 < s < 5.04 nm-1. The SAXS data were acquired for a dilution series (1.7, 5.2 and 7.1 mg/mL) measured with the robotic sample changer at 10°C. Radial averaging, frame averaging and buffer subtraction were done using standard protocols. No concentration effects were observed between the three measured concentrations and curves from all measurements were merged to reduce interparticle interactions appearing at the beginning of the curve while preserving a good signal to noise ratio at the end and averaged curve was used for the subsequent structural analysis. The forward scattering intensity, I(0), and the radius of gyration, Rg, were evaluated using Guinier’s approximation, assuming that at very small angles (s < 1.3/Rg), the intensity can be described as I(s)=I(0)e^(-((sRg)²)⁄3).
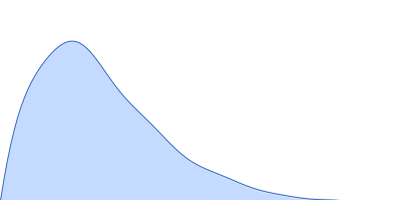
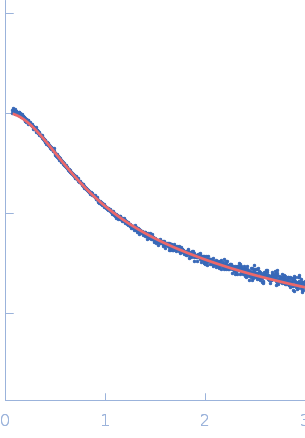
For the model ensemble displayed in this entry, simulated SAXS curves from NMR RDC-derived structures were calculated using CRYSOL after the addition of side chains using SCRWL for each conformer. Then, the individual SAXS curves from the members of the ensemble were averaged to obtain the representative scattering curve of the model cohort. The resulting scattering profile from the NMR-model ensemble were directly compared with the experimental SAXS profiles by scaling the theoretical curve using a momentum transfer range of 0.015 < s < 0.50 Å-1 (represented in the fitting plot displayed above). Constant subtraction was employed. A total of 2,000 conformers were used to calculate the average curve, which was sufficient to reach convergence. The image for this entry represents only a sub-set example (of 25 models) from total (500) model ensemble of which the complete atomic coordinate files maybe accessed at the Protein Ensemble Database (PED) entry PED00184 (https://proteinensemble.org/entries/PED00184). Note: The displayed p(r) should be interpreted as an estimated volume-fraction weighted real-space distribution from the contributions of each individual-component within the ensemble.
|
|
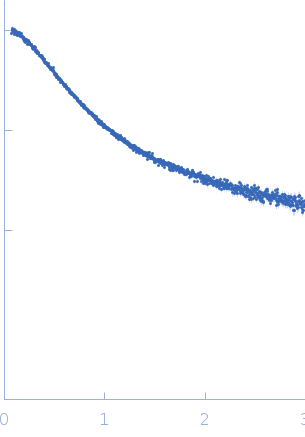 s, nm-1
![Nuclear receptor coactivator 2 OTHER [STATIC IMAGE] model](/media//pdb_file/SASDK68_fit1_model1.png "Static model image")