Garcia-Rodriguez G
Girardin Y,
Volkov A,
Singh R,
Muruganandam G,
Van Dyck J,
Sobott F,
Versées W,
Charlier D,
Loris R,
Acta Crystallographica Section D Structural Biology
77(7):904-920
(2021)
DOI
SASDKY6 – ParD2 antitoxin from Vibrio cholerae in low salt pH 8
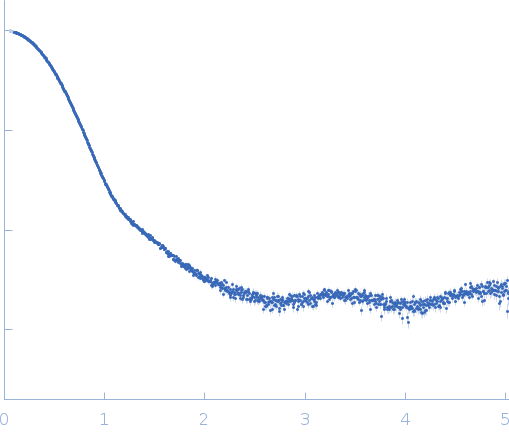
Synchrotron SAXS data from solutions of the ParD2 antitoxin from Vibrio cholerae in 20 mM Tris, 150 mM NaCl, 1 mM TCEP, pH 8 were collected on the SWING beam line at SOLEIL (Saint-Aubin, France) using a Eiger 4M detector at a sample-detector distance of 2.0 m and at a wavelength of λ = 0.103219 nm (I(s) vs s, where s = 4πsinθ/λ, and 2θ is the scattering angle). In-line size-exclusion chromatography (SEC) SAS was employed. The SEC parameters were as follows: A 50.00 μl sample at 12 mg/ml was injected at a 0.20 ml/min flow rate onto a Agilent Bio SEC-3, 300 Å column at 19°C. The data (0.990 s frames) were normalized to the intensity of the transmitted beam and radially averaged; the scattering of the solvent-blank was subtracted.
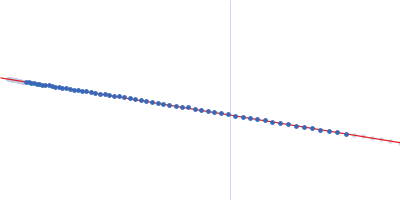
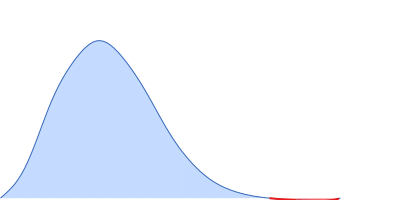
Slight repulsive interparticle interference is noted in the Guinier plot and p(r) profile.
 s, nm-1