Microphthalmia-associated transcription factor (MITF) calmodulin (Cam) complex

Cy M Jeffries.

SASDMP5 – Microphthalmia-associated transcription factor (MITF) bound to calcium-loaded calmodulin (Cam)

Microphthalmia-associated transcription factor
Calmodulin-1
MWexperimental 62 kDa
MWexpected 62 kDa
VPorod 117 nm3
log I(s) 1.47×10⁴ 1.47×10³ 1.47×10² 1.47×101
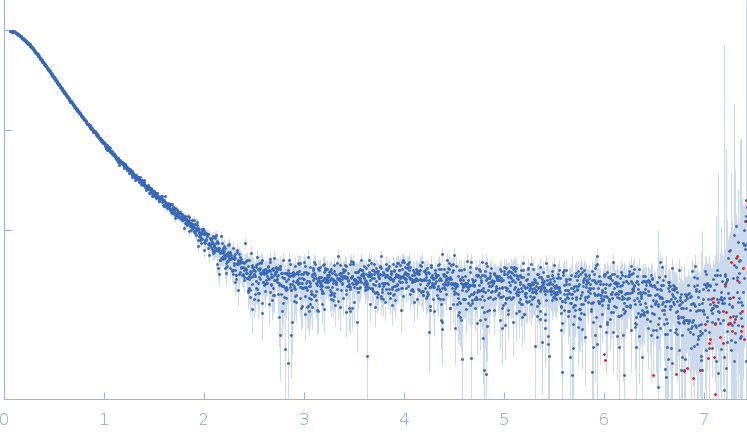
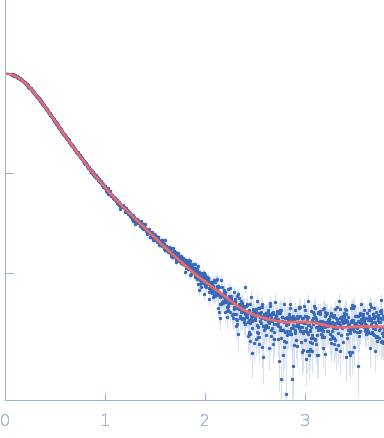
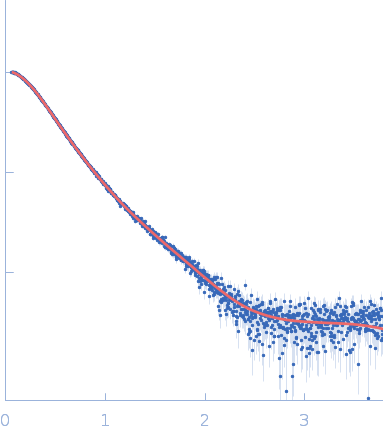
Microphthalmia-associated transcription factor Calmodulin-1 small angle scattering data  s, nm-1
ln I(s)
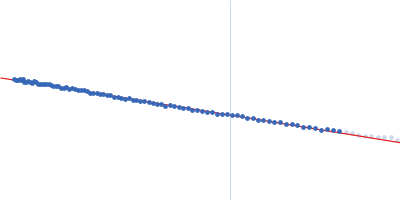
Microphthalmia-associated transcription factor Calmodulin-1 Guinier plot ln 1.47×10⁴ Rg: 4.0 nm 0 (4.0 nm)-2 s2
(sRg)2I(s)/I(0)
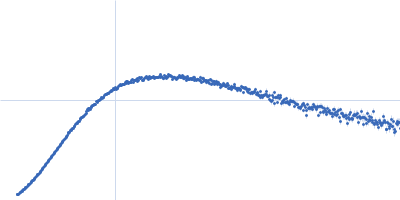
Microphthalmia-associated transcription factor Calmodulin-1 Kratky plot 1.104 0 √3 sRg
p(r)
Microphthalmia-associated transcription factor Calmodulin-1 pair distance distribution function Rg: 4.2 nm 0 Dmax: 17 nm

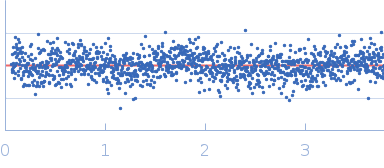
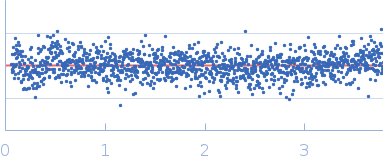
Data validation


Fits and models


log I(s)
 s, nm-1
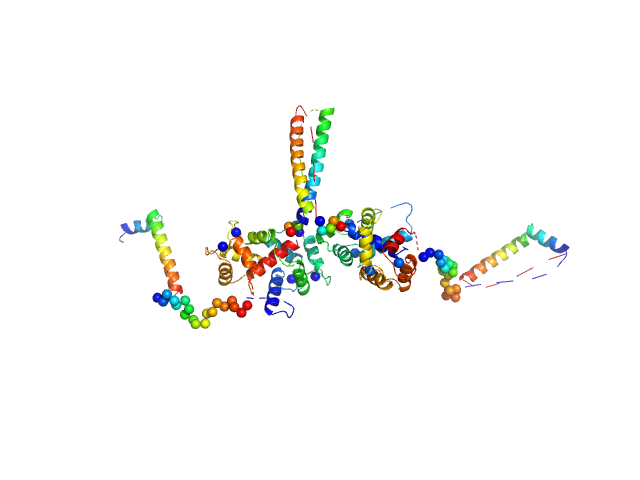
Microphthalmia-associated transcription factor Calmodulin-1 OTHER [STATIC IMAGE] model
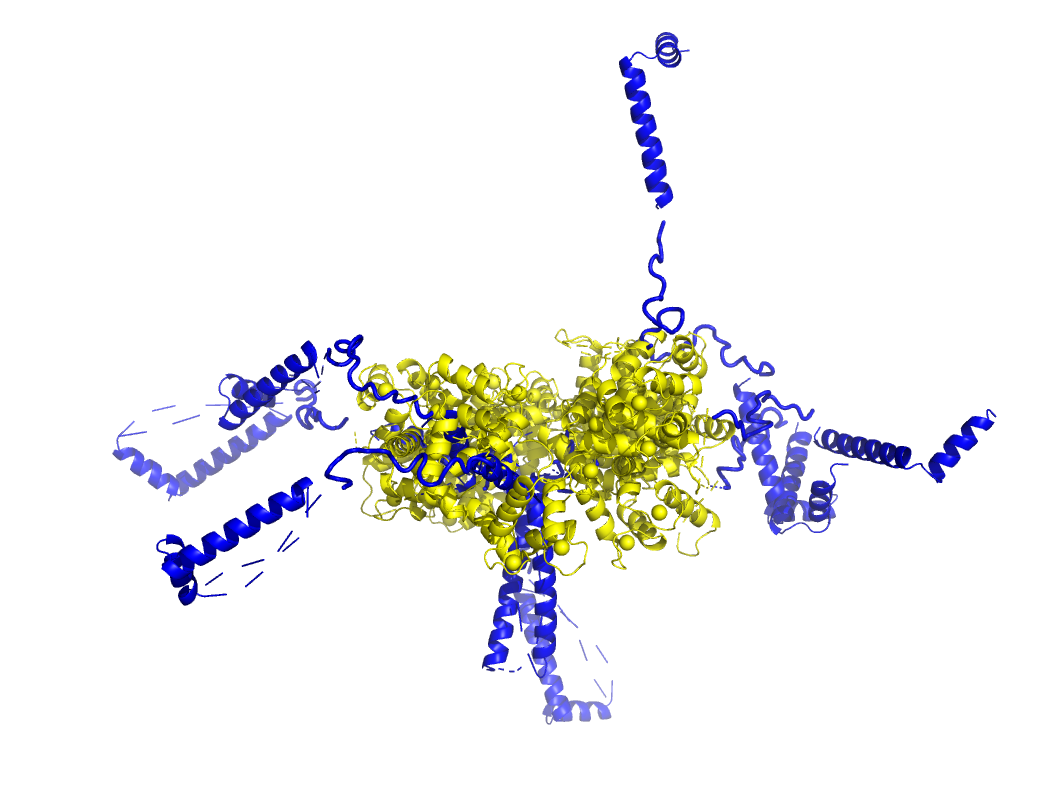
Microphthalmia-associated transcription factor Calmodulin-1 CORAL model

log I(s)
 s, nm-1
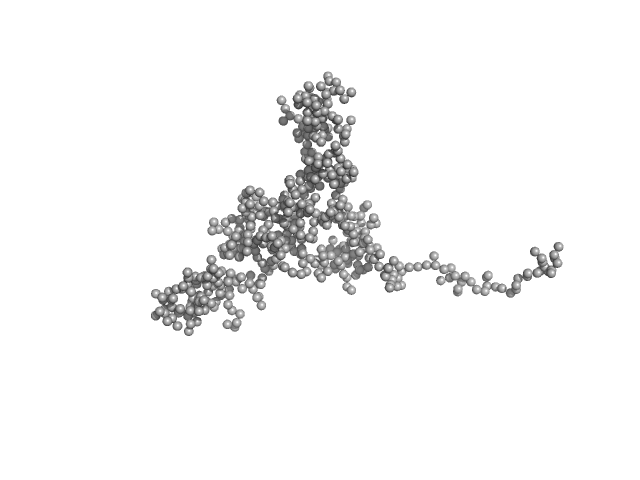
Microphthalmia-associated transcription factor Calmodulin-1 GASBOR model

Synchrotron SAXS data from solutions of the MITF-Cam complex in 50 mM HEPES, 150 mM NaCl, 10 mM CaCl2, pH 7.2 were collected on the EMBL P12 beam line at PETRA III (DESY, Hamburg, Germany) using a Pilatus 6M detector at a sample-detector distance of 3 m and at a wavelength of λ = 0.124 nm (I(s) vs s, where s = 4πsinθ/λ, and 2θ is the scattering angle). In-line size-exclusion chromatography (SEC) SAS was employed. The SEC parameters were as follows: A 50.00 μl sample at 12 mg/ml was injected at a 0.30 ml/min flow rate onto a GE Superdex 200 Increase 5/150 column at 20°C. 36 successive 0.250 second frames were collected through the sample elution peak. The data were normalized to the intensity of the transmitted beam and radially averaged; the scattering of the solvent-blank was subtracted using CHROMIXS software.

The SEC-SAXS data, the Rg correlation through the SEC-SAXS peak and alternative models of the MITF-Cam complex are provided in the full entry zip archive. The models of the MITF-Cam complex shown in this entry are: Top - an individual CORAL model and an example model fit to the data, with a representation of the structural ensemble aligned to the coiled-coil domain of the MITF dimer (blue) bound to two Cam (yellow). Bottom - a GASBOR dummy residue model representation of the MITF-Cam complex.

Microphthalmia-associated transcription factor (MITF)
Mol. type   Protein
Organism   Mus musculus
Olig. state   Dimer
Mon. MW   14.3 kDa
 
UniProt   Q08874 (287-403)
Sequence   FASTA
 
Calmodulin-1 (Cam (2-mer))
Mol. type   Protein
Organism   Xenopus laevis
Olig. state   Dimer
Mon. MW   16.7 kDa
 
UniProt   P0DP33 (2-149)
Sequence   FASTA