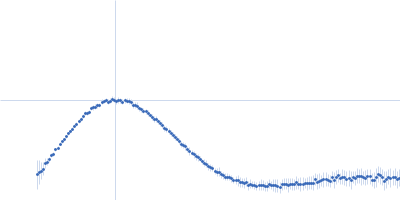
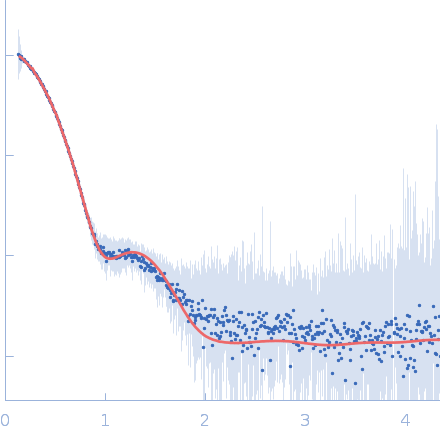
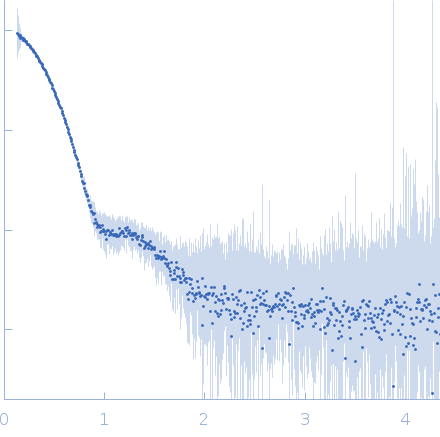
Kinetic and Structural Characterization of a Flavin-Dependent Putrescine N-Hydroxylase from Acinetobacter baumannii.

Lyons NS, Bogner AN, Tanner JJ, Sobrado P, Biochemistry (2022) Europe PMC

SASDNA9 – Acinetobacter baumannii putrescine N-hydroxylase, 1 mg/mL

L-lysine 6-monooxygenase (NADPH-requiring)
MWexperimental 186 kDa
MWexpected 214 kDa
VPorod 394 nm3
log I(s) 6.60×101 6.60×100 6.60×10⁻¹ 6.60×10⁻²
L-lysine 6-monooxygenase (NADPH-requiring) small angle scattering data  s, nm-1
ln I(s)
L-lysine 6-monooxygenase (NADPH-requiring) Guinier plot ln 6.61×101 Rg: 4.1 nm 0 (4.1 nm)-2 s2
(sRg)2I(s)/I(0)
L-lysine 6-monooxygenase (NADPH-requiring) Kratky plot 1.104 0 3 sRg
p(r)
L-lysine 6-monooxygenase (NADPH-requiring) pair distance distribution function Rg: 4.2 nm 0 Dmax: 15 nm

Data validation


Fits and models


log I(s)
 s, nm-1
L-lysine 6-monooxygenase (NADPH-requiring) ALLOSMOD model

Synchrotron SAXS data from solutions of Acinetobacter baumannii putrescine N-hydroxylase, 1 mg/mL in 25 mM HEPES pH 7.5, 150 mM NaCl, 1 mM TCEP, pH 7.5 were collected on the 12.3.1 (SIBYLS) beam line at the Advanced Light Source (ALS) storage ring (Berkeley, CA, USA) using a Pilatus3 X 2M detector at a sample-detector distance of 2 m and at a wavelength of λ = 0.1234 nm (I(s) vs s, where s = 4πsinθ/λ, and 2θ is the scattering angle). One solute concentration of 1.00 mg/ml was measured at 20°C. 30 successive 0.300 second frames were collected. The data were normalized to the intensity of the transmitted beam and radially averaged; the scattering of the solvent-blank was subtracted.

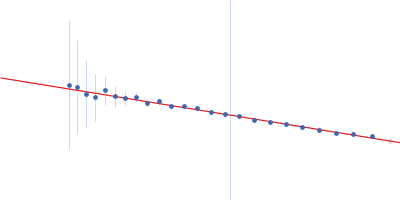
The deposited scattering curve was averaged using FrameSlice, using frames 1-2 in the Guinier region and frames 1-30 in the other q regions. The first 5 (lowest q) data points were omitted based on analysis with Primus AutoRg.

L-lysine 6-monooxygenase (NADPH-requiring) (FbsI)
Mol. type   Protein
Organism   Acinetobacter baumannii MRSN 3527
Olig. state   Tetramer
Mon. MW   53.5 kDa
 
UniProt   A0A0J0ZLX8 (1-446)
Sequence   FASTA