| MWexperimental | 34 | kDa |
| MWexpected | 101 | kDa |
| VPorod | 41 | nm3 |
|
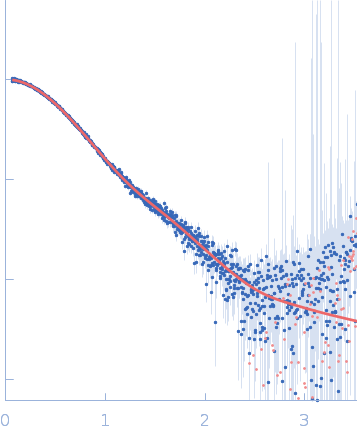
log I(s)
1.35×10⁻²
1.35×10⁻³
1.35×10⁻⁴
1.35×10⁻⁵
|
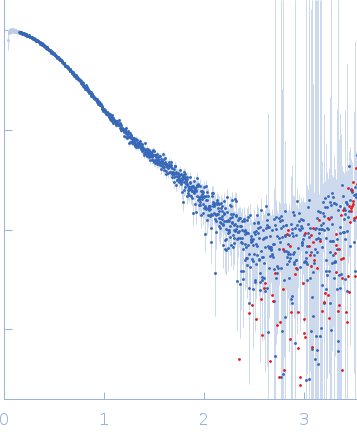 s, nm-1
|
|
|
|

|
|
|
|
On the day of data collection the samples were thawed and spun down. 1 mM DTT was added to the samples and buffer. The samples were injected onto a GE Superdex 200 Increase column at 22˚C in buffer containing 20 mM Tris pH 8, 350 mM NaCl, 1 mM DTT at a flow rate of 0.5 mL/min. Data were collected at APS’s BioCAT Beamline18ID using synchrotron radiation from Undulator A. As the sample came off of the column it was first detected by UV, followed by Wyatt DAWN HELEOS II MALS+DLS and Wyatt Optilab T-rEX dRI detectors for measuring molecular weight through MALS-DLS-RI analysis. Following MALS-DLS, the sample flowed to the SAXS sample chamber where data were collected by a Pilatus3 X 1M detector with a wavelength of 1.033 Å, camera length of 3.628 m, an exposure time of 0.5 s, and a q-measurement range of 0.0045 to 0.35 Å-1. Data were normalized using an active beamstop containing a silicon PIN diode.
|
|
|||||||||||||||||||||||||||