VISUALIZING THE NUCLEATING AND CAPPED STATES OF F-ACTIN BY Ca^2+-ACTIVATED GELSOLIN

FNU Ashish.

SASDU94 – Calcium-gelsolin and the G-form of actin at a 1:1 molar ratio in low ionic strength (SEC-SAXS)

Gelsolin
Actin, cytoplasmic 1
MWexperimental 168 kDa
MWexpected 126 kDa
VPorod 243 nm3
log I(s) 6.23×10² 6.23×101 6.23×100 6.23×10⁻¹
Gelsolin Actin, cytoplasmic 1 small angle scattering data  s, nm-1
ln I(s)
Gelsolin Actin, cytoplasmic 1 Guinier plot ln 6.24×10² Rg: 4.6 nm 0 (4.6 nm)-2 s2
(sRg)2I(s)/I(0)
Gelsolin Actin, cytoplasmic 1 Kratky plot 1.104 0 3 sRg
p(r)
Gelsolin Actin, cytoplasmic 1 pair distance distribution function Rg: 4.3 nm 0 Dmax: 25 nm

Data validation


Fits and models


log I(s)
 s, nm-1
Gelsolin Actin, cytoplasmic 1 GASBOR model

Synchrotron SAXS data from solutions of Calcium-gelsolin and the G-form of actin at a 1:1 molar ratio in low ionic strength (SEC-SAXS) in 2 mM Tris-Cl, pH 8.0, 0.2 mM ATP, 1 mM NaN3, 0.1 mM CaCl2, 0.5 mM DTT, pH 8 were collected on the EMBL P12 beam line at the PETRA III storage ring (DESY; Hamburg, Germany) using a Pilatus 2M detector at a sample-detector distance of 3.1 m and at a wavelength of λ = 0.155 nm 
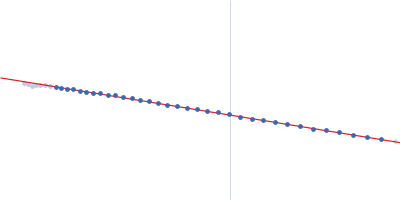
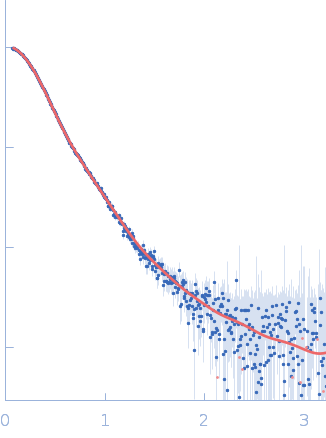
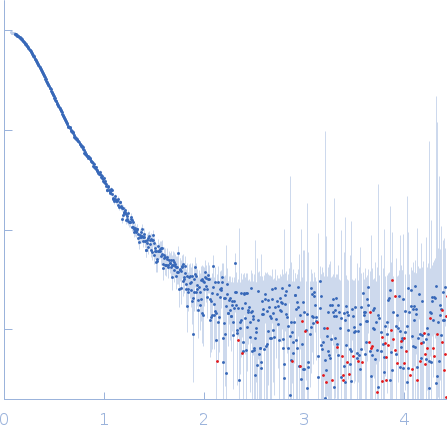
(I(s) vs s, where s = 4πsinθ/λ, and 2θ is the scattering angle). In-line size-exclusion chromatography (SEC) SAS was employed. The SEC parameters were as follows: A 500.00 μl sample at 2 mg/ml was injected at a 0.50 ml/min flow rate onto a GE Superdex 200 10/300 column at 10°C. 20 successive 1 second frames were collected. The data were normalized to the intensity of the transmitted beam and radially averaged; the scattering of the solvent-blank was subtracted.

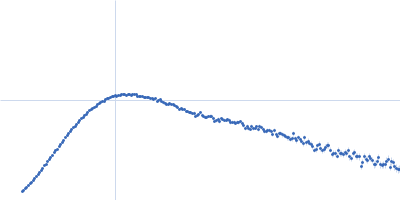
CAUTION: The calculated p(r) is categorised as a SUSPICIOUS solution. Dmax over-estimated.

Gelsolin (rhuGSN)
Mol. type   Protein
Organism   Homo sapiens
Olig. state   Monomer
Mon. MW   84.3 kDa
 
UniProt   P06396 (25-782)
Sequence   FASTA
 
Actin, cytoplasmic 1
Mol. type   Protein
Organism   Gallus gallus
Olig. state   Monomer
Mon. MW   41.7 kDa
 
UniProt   P60706 (1-375)
Sequence   FASTA