|
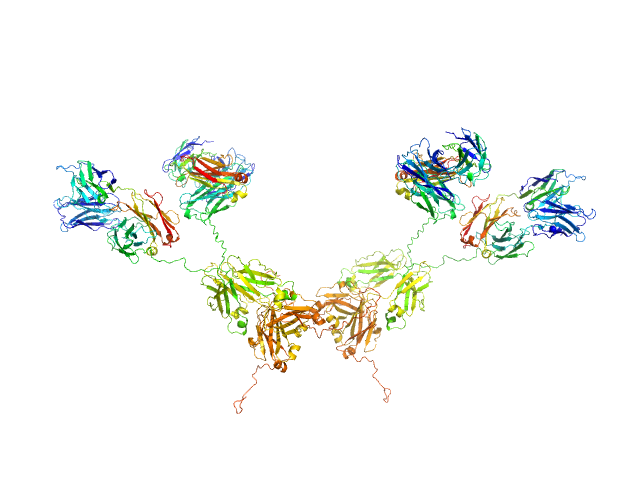
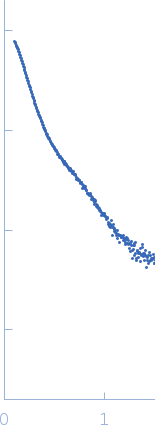
Synchrotron SAXS
data from solutions of
IgA1 dimer - Patient C
in
PBS buffer, 137 mM NaCl, 8.2 mM Na2HPO4, 2.6 mM KCl, 1.5 mM KH2PO4, pH 7.4
were collected
on the
BM29 beam line
at the ESRF storage ring
(Grenoble, France)
using a Pilatus 1M detector
at a sample-detector distance of 2.9 m and
at a wavelength of λ = 0.09919 nm
(I(s) vs s, where s = 4πsinθ/λ, and 2θ is the scattering angle).
Solute concentrations ranging between 0.3 and 1.3 mg/ml were measured
at 20°C.
10 successive
1 second frames were collected.
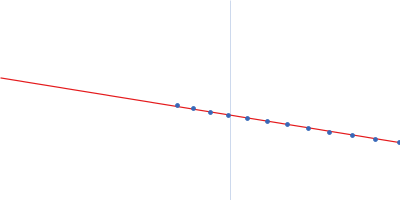
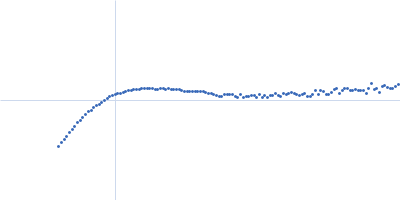
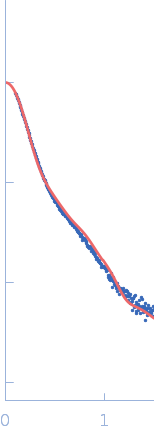
The data were normalized to the intensity of the transmitted beam and radially averaged; the scattering of the solvent-blank was subtracted.
The low angle data collected at lower concentrations were extrapolated to infinite dilution and merged with the higher concentration data to yield the final composite scattering curve.
CAUTION: Errors associated with the scattering data points are not available.
|
|

 s, nm-1