Waris S,
García-Mauriño SM,
Sivakumaran A,
Beckham SA,
Loughlin FE,
Gorospe M,
Díaz-Moreno I,
Wilce MCJ,
Wilce JA,
Nucleic Acids Res
45(8):4944-4957
(2017)
Europe PMC
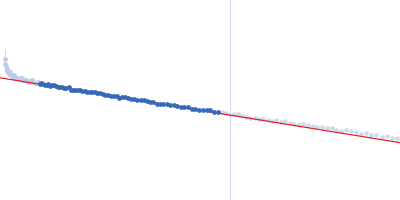
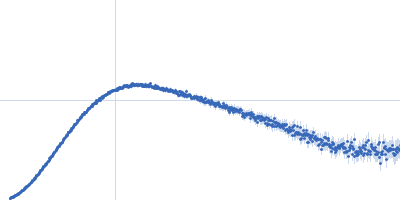
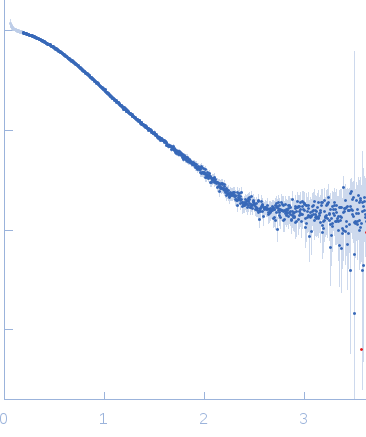
SASDBP6 – Nucleolysin TIA-1 isoform p40 in complex with ACTCCTTTTT DNA
Synchrotron SAXS data from solutions of Nucleolysin TIA-1 isoform p40 in complex with DNA (ACTCCTTTTT) in 20 mM HEPES, 100mM NaCl, 3% v/v glycerol, pH 7 were collected on the SAXS/WAXS beam line at the Australian Synchrotron (Melbourne, Australia) using a Pilatus 1M detector at a sample-detector distance of 1.6 m and at a wavelength of λ = 0.1033 nm (I(s) vs s, where s = 4π sin θ/λ and 2θ is the scattering angle). The data were collected as 30 successive 1 second frames and were normalized to the intensity of the transmitted beam and radially averaged. The radially-averaged scattering of the solvent-blank was subtracted to produce the results displayed in this entry that shows the scattering profile from a sample at 2.5 mg/ml maintained at 15°C during the SAXS measurements.
 s, nm-1