|
|
|
|
|
| Sample: |
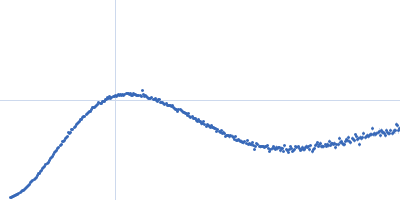
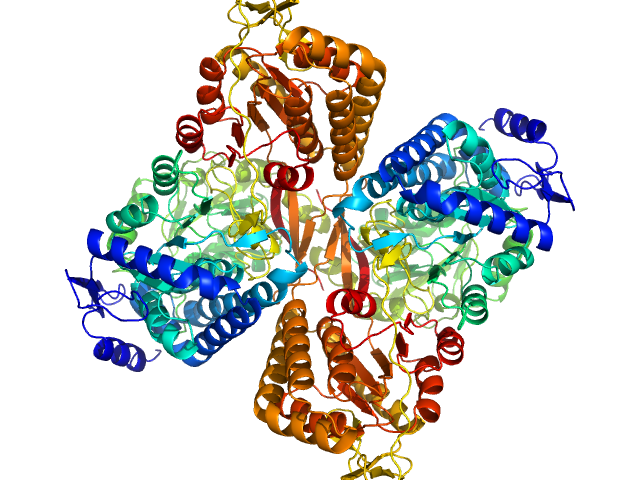
Aldehyde dehydrogenase 16 from Loktanella sp. dimer, 161 kDa Loktanella sp. 3ANDIMAR09 protein
|
| Buffer: |
20 mM Tris-HCl, 100 mM NaCl, 2.0% glycerol, 0.5 mM Tris(3-hydroxypropyl)phosphine, pH: 8
|
| Experiment: |
SAXS
data collected at 12.3.1 (SIBYLS), Advanced Light Source (ALS) on 2017 Dec 13
|
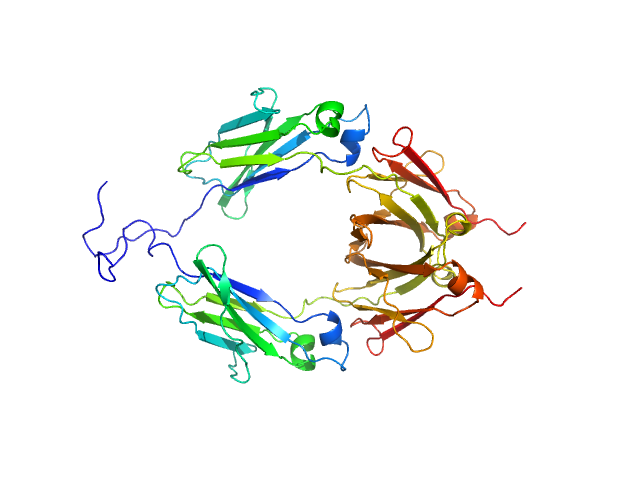
Crystal Structure of Aldehyde Dehydrogenase 16 Reveals Trans-Hierarchical Structural Similarity and a New Dimer.
J Mol Biol (2018)
Liu LK, Tanner JJ
|
| RgGuinier |
3.6 |
nm |
| Dmax |
10.8 |
nm |
| VolumePorod |
205 |
nm3 |
|
|
|
|
|
|

|
| Sample: |
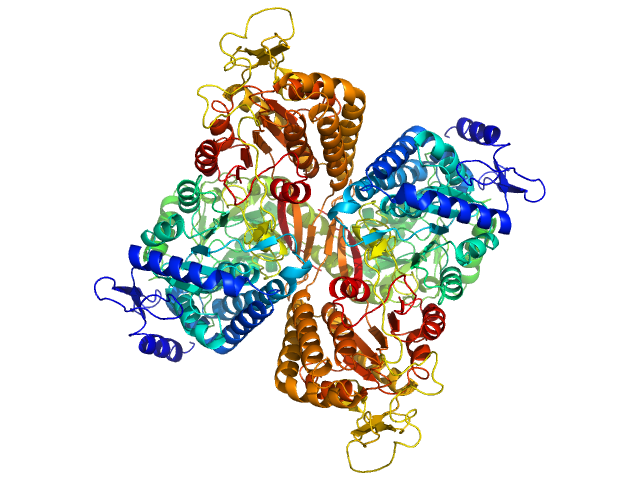
Aldehyde dehydrogenase family 16 member A1 from Homo sapiens dimer, 171 kDa Homo sapiens protein
|
| Buffer: |
20 mM Tris-HCl, 100 mM NaCl, 2.0% glycerol, 0.5 mM Tris(3-hydroxypropyl)phosphine, pH: 8
|
| Experiment: |
SAXS
data collected at 12.3.1 (SIBYLS), Advanced Light Source (ALS) on 2017 Dec 13
|
Crystal Structure of Aldehyde Dehydrogenase 16 Reveals Trans-Hierarchical Structural Similarity and a New Dimer.
J Mol Biol (2018)
Liu LK, Tanner JJ
|
| RgGuinier |
3.6 |
nm |
| Dmax |
10.9 |
nm |
| VolumePorod |
230 |
nm3 |
|
|
|
|
|
|

|
| Sample: |
Aldehyde dehydrogenase family 16 member A1 from Homo sapiens dimer, 171 kDa Homo sapiens protein
|
| Buffer: |
20 mM Tris-HCl, 100 mM NaCl, 2.0% glycerol, 0.5 mM Tris(3-hydroxypropyl)phosphine, pH: 8
|
| Experiment: |
SAXS
data collected at 12.3.1 (SIBYLS), Advanced Light Source (ALS) on 2017 Dec 13
|
Crystal Structure of Aldehyde Dehydrogenase 16 Reveals Trans-Hierarchical Structural Similarity and a New Dimer.
J Mol Biol (2018)
Liu LK, Tanner JJ
|
| RgGuinier |
3.8 |
nm |
| Dmax |
11.2 |
nm |
| VolumePorod |
236 |
nm3 |
|
|
|
|
|
|
|
| Sample: |
Aldehyde dehydrogenase family 16 member A1 from Homo sapiens dimer, 171 kDa Homo sapiens protein
|
| Buffer: |
20 mM Tris-HCl, 100 mM NaCl, 2.0% glycerol, 0.5 mM Tris(3-hydroxypropyl)phosphine, pH: 8
|
| Experiment: |
SAXS
data collected at 12.3.1 (SIBYLS), Advanced Light Source (ALS) on 2017 Dec 13
|
Crystal Structure of Aldehyde Dehydrogenase 16 Reveals Trans-Hierarchical Structural Similarity and a New Dimer.
J Mol Biol (2018)
Liu LK, Tanner JJ
|
| RgGuinier |
3.8 |
nm |
| Dmax |
11.5 |
nm |
| VolumePorod |
237 |
nm3 |
|
|
|
|
|
|
|
| Sample: |
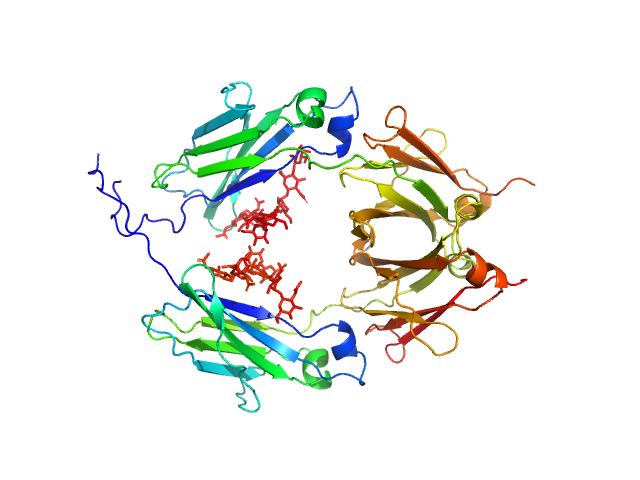
Glycosylated human immunoglobulin G Fc region dimer, 53 kDa Homo sapiens protein
|
| Buffer: |
20 mM Citrate-Phosphate, pH: 7
|
| Experiment: |
SAXS
data collected at BL-10C, Photon Factory (PF), High Energy Accelerator Research Organization (KEK) on 2017 Mar 5
|
CH2 domain orientation of human immunoglobulin G in solution: Structural comparison of glycosylated and aglycosylated Fc regions using small-angle X-ray scattering.
MAbs (2018)
Yageta S, Imamura H, Shibuya R, Honda S
|
| RgGuinier |
2.7 |
nm |
| Dmax |
10.2 |
nm |
| VolumePorod |
66 |
nm3 |
|
|
|
|
|
|
|
| Sample: |
Aglycosylated human immunoglobulin G Fc region dimer, 51 kDa Homo sapiens protein
|
| Buffer: |
20 mM Citrate-Phosphate, pH: 7
|
| Experiment: |
SAXS
data collected at BL-10C, Photon Factory (PF), High Energy Accelerator Research Organization (KEK) on 2017 Mar 5
|
CH2 domain orientation of human immunoglobulin G in solution: Structural comparison of glycosylated and aglycosylated Fc regions using small-angle X-ray scattering.
MAbs (2018)
Yageta S, Imamura H, Shibuya R, Honda S
|
| RgGuinier |
2.9 |
nm |
| Dmax |
9.8 |
nm |
| VolumePorod |
60 |
nm3 |
|
|
|
|
|
|
|
| Sample: |
Type II secretion system protein L, periplasmic domain dimer, 28 kDa Pseudomonas aeruginosa protein
|
| Buffer: |
50 mM TRIS, 100 mM NaCl, pH: 7.5
|
| Experiment: |
SAXS
data collected at SWING, SOLEIL on 2016 Apr 8
|
Structure and oligomerization of the periplasmic domain of GspL from the type II secretion system of Pseudomonas aeruginosa.
Sci Rep 8(1):16760 (2018)
Fulara A, Vandenberghe I, Read RJ, Devreese B, Savvides SN
|
| RgGuinier |
2.2 |
nm |
| Dmax |
7.5 |
nm |
|
|
|
|
|
|
|
| Sample: |
Type II secretion system protein L, periplasmic domain dimer, 28 kDa Pseudomonas aeruginosa protein
|
| Buffer: |
50 mM TRIS, 100 mM NaCl, pH: 7.5
|
| Experiment: |
SAXS
data collected at SWING, SOLEIL on 2016 Apr 8
|
Structure and oligomerization of the periplasmic domain of GspL from the type II secretion system of Pseudomonas aeruginosa.
Sci Rep 8(1):16760 (2018)
Fulara A, Vandenberghe I, Read RJ, Devreese B, Savvides SN
|
| RgGuinier |
3.2 |
nm |
| Dmax |
10.5 |
nm |
|
|
|
|
|
|
|
| Sample: |
Membrane scaffold protein 1D1 (deuterated, 75%) dimer, 49 kDa protein
1-palmitoyl-2-palmitoleoyl-sn-glycero-3-phosphocholine (deuteration: 78% head, 92% acyl) , 1 kDa Escherichia coli
Calcium-transporting ATPase 8, plasma membrane-type monomer, 118 kDa Arabidopsis thaliana protein
|
| Buffer: |
30 mM Tris, 150 mM NaCl, 1mM MgCl2, 1 mM CaCl2, pH: 7.5
|
| Experiment: |
SAXS
data collected at EMBL P12, PETRA III on 2017 Sep 8
|
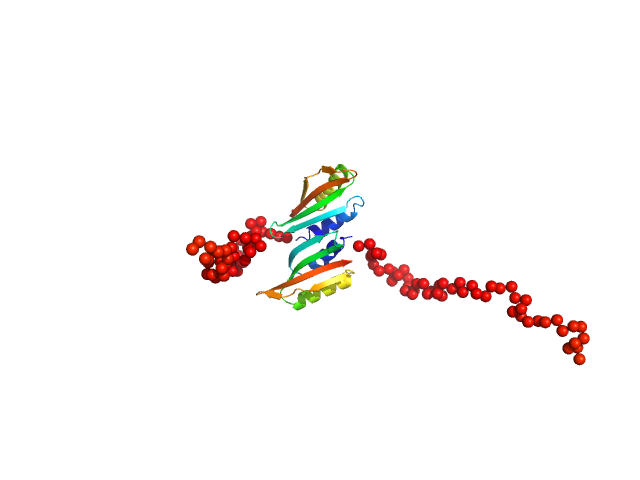
Structural basis for activation of plasma-membrane Ca2+-ATPase by calmodulin.
Commun Biol 1:206 (2018)
Nitsche J, Josts I, Heidemann J, Mertens HD, Maric S, Moulin M, Haertlein M, Busch S, Forsyth VT, Svergun DI, Uetrecht C, Tidow H
|
| RgGuinier |
5.3 |
nm |
| Dmax |
20.0 |
nm |
| VolumePorod |
626 |
nm3 |
|
|
|
|
|
|
|
| Sample: |
Membrane scaffold protein 1D1 (deuterated, 75%) dimer, 49 kDa protein
1-palmitoyl-2-palmitoleoyl-sn-glycero-3-phosphocholine (deuteration: 78% head, 92% acyl) , 1 kDa Escherichia coli
Calcium-transporting ATPase 8, plasma membrane-type monomer, 118 kDa Arabidopsis thaliana protein
Calmodulin-7 monomer, Arabidopsis thaliana protein
|
| Buffer: |
30 mM Tris, 150 mM NaCl, 1mM MgCl2, 1 mM CaCl2, pH: 7.5
|
| Experiment: |
SAXS
data collected at EMBL P12, PETRA III on 2017 Sep 8
|
Structural basis for activation of plasma-membrane Ca2+-ATPase by calmodulin.
Commun Biol 1:206 (2018)
Nitsche J, Josts I, Heidemann J, Mertens HD, Maric S, Moulin M, Haertlein M, Busch S, Forsyth VT, Svergun DI, Uetrecht C, Tidow H
|
| RgGuinier |
5.9 |
nm |
| Dmax |
22.0 |
nm |
| VolumePorod |
805 |
nm3 |
|
|


1-palmitoyl-2-palmitoleoyl-sn-glycero-3-phosphocholine (deuteration: 78% head, 92% acyl)Calcium-transporting ATPase 8, plasma membrane-type experimental SAS data")
1-palmitoyl-2-palmitoleoyl-sn-glycero-3-phosphocholine (deuteration: 78% head, 92% acyl)Calcium-transporting ATPase 8, plasma membrane-typeCalmodulin-7 experimental SAS data")