|
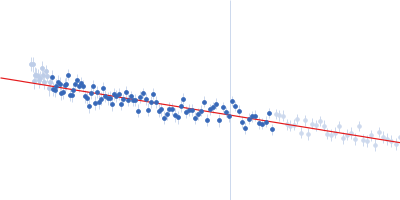
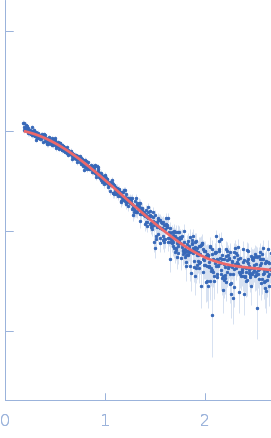
Synchrotron SAXS
data from solutions of
The Fe–S cluster assembly 1 homolog of pigeon (Elution No.300)
in
20 mM Tris-HCl, 0.15 M NaCl, 10 mM 3-mercapto-1,2-propanediol, pH 8
were collected
on the
BL-10C beam line
at the Photon Factory (PF), High Energy Accelerator Research Organization (KEK) storage ring
(Tsukuba, Japan)
using a Pilatus3 2M detector
at a sample-detector distance of 2 m and
at a wavelength of λ = 0.15 nm
(I(s) vs s, where s = 4πsinθ/λ, and 2θ is the scattering angle).
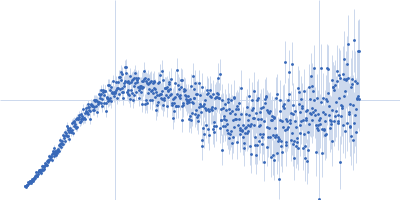
In-line size-exclusion chromatography (SEC) SAS was employed. The SEC parameters were as follows: A 500.00 μl sample
at 6.9 mg/ml was injected at a 0.05 ml/min flow rate
onto a GE Superose 6 Increase 10/300 column
at 20°C.
One
20 second frame was collected.
The data were normalized to the intensity of the transmitted beam and radially averaged; the scattering of the solvent-blank was subtracted.
I(q) at the elution No. 300 was obtained by averaging data frames 298-302, in order to improve the statistical accuracy of the data. The averaged Rg was evaluated by the program Serial Analyzer ver. 1.3.0 [K. Yonezawa, M. Takahashi, K. Yatabe, Y. Nagatani, N. Shimizu, Software for serial data analysis measured by SEC-SAXS/UV-Vis spectroscopy, AIP Conf. Proc. 2054, 060082 (2019)]. The averaged Mw was evaluated by the program Oligomer. For oligomer analysis, the globular clISCA1 protomer (Type-A) model was generated by the Rosetta Ab Initio modeling. The rod-like clISCA1 protomer (Type-B) model was generated by the Rosetta comparative modeling with the conformations of the chains B and D of 1X0G as the templates. The oligomer models of clISCA1 were constructed based on the crystal packing patterns of 1R94 for the Type-A oligomer and of 1X0G for the Type-B oligomer.
|
|
 s, nm-1