|
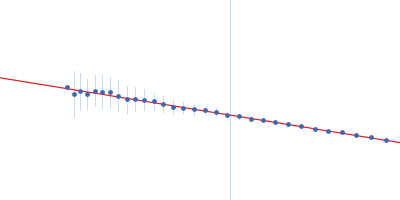
Synchrotron SAXS data from solutions of aldehyde dehydrogenase in 50 mM Tris-HCl, 50 mM NaCl, 0.5 mM TCEP, and 5% (v/v) glycerol, pH 7.8 were collected on the 12.3.1 (SIBYLS) beam line at the Advanced Light Source (ALS, Berkeley, CA, USA) using a Pilatus3 X 2M detector at a sample-detector distance of 1.5 m and at a wavelength of λ = 0.127 nm (l(s) vs s, where s = 4πsinθ/λ, and 2θ is the scattering angle). 33 successive 0.300 second frames were collected at a sample temperature of 10°C. The data were normalized to the intensity of the transmitted beam and radially averaged; the scattering of the solvent-blank was subtracted. The low angle data collected at lower concentrations were extrapolated to infinite dilution and merged with the higher concentration data to yield the final composite scattering curve.
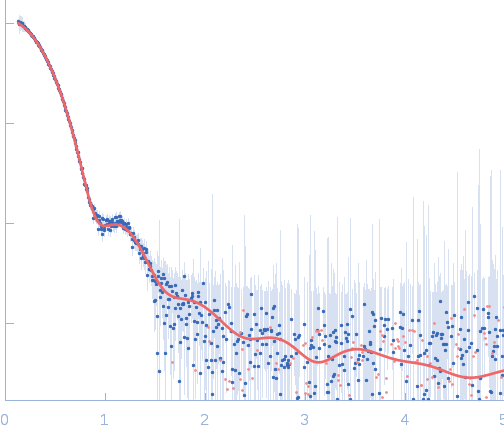
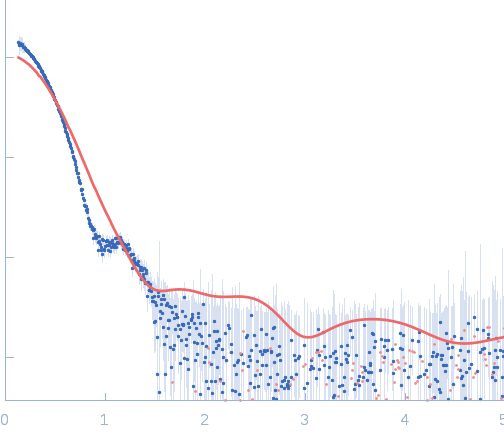
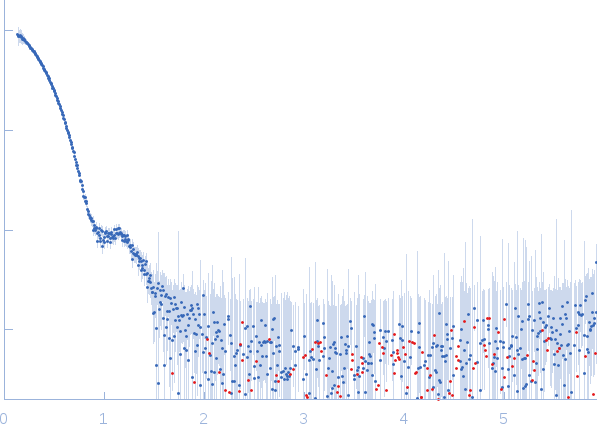
This is the background subtracted experimental SAXS data extrapolated to infinite dilution. The original experiment consisted of static SAXS samples collected at 3 protein concentrations in the range of 0.9 - 2.6 mg/mL. The data were extrapolated to infinite dilution to account for sample aggregation in the two higher concentration samples. The corresponding model fits of the tetramer (top) and dimer (bottom) demonstrate that the dimer does not fit the SAXS data.
|
|
 s, nm-1