The quaternary structure of insulin glargine and glulisine under formulation conditions.

Nagel N, Graewert MA, Gao M, Heyse W, Jeffries CM, Svergun D, Berchtold H, Biophys Chem 253:106226 (2019) Europe PMC

SASDFB4 – Insulin glargine (Lantus ®), oligomeric mixture

Insulin glargine (Lantus ®)
MWI(0) 35 kDa
MWexpected 36 kDa
log I(s) 6.45×10² 6.45×101 6.45×100 6.45×10⁻¹
Insulin glargine (Lantus ®) small angle scattering data  s, nm-1
ln I(s)
Insulin glargine (Lantus ®) Guinier plot ln 6.45×10² Rg: 1.8 nm 0 (1.8 nm)-2 s2
(sRg)2I(s)/I(0)
Insulin glargine (Lantus ®) Kratky plot 1.104 0 3 sRg
p(r)
Insulin glargine (Lantus ®) pair distance distribution function Rg: 1.8 nm 0 Dmax: 5.3 nm

Data validation


There are no models related to this curve.

Synchrotron SAXS data from solutions of Insulin glargine (Lantus ®), oligomeric mixture in Lantus Formulation (30 µg Zinc cloride, 2.7 mg m-Cresol, 20 mg glycerol 85%), pH 4 were collected on the EMBL P12 beam line at the PETRA III storage ring (DESY; Hamburg, Germany) using a Pilatus 2M detector at a sample-detector distance of 3.1 m and at a wavelength of λ = 1.241 nm 
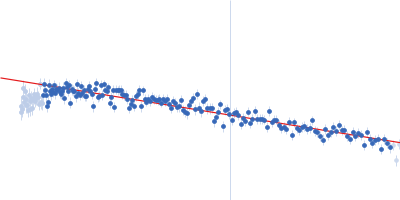
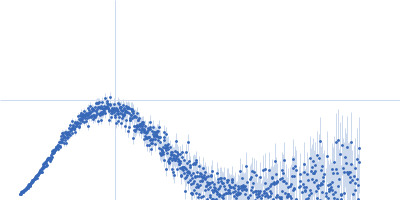
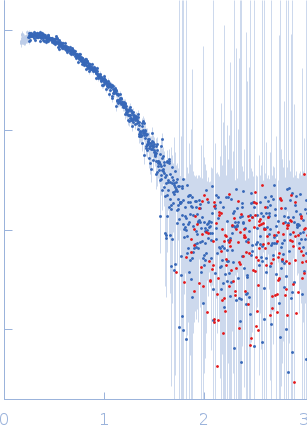
(I(s) vs s, where s = 4πsinθ/λ, and 2θ is the scattering angle). One solute concentration of 3.64 mg/ml was measured at 20°C. 20 successive 0.045 second frames were collected. The data were normalized to the intensity of the transmitted beam and radially averaged; the scattering of the solvent-blank was subtracted.

Insulin glargine (Lantus ®)
Mol. type   Protein
Olig. state   Hexamer
Mon. MW   6.1 kDa
Sequence   FASTA