|
|
|
|
|
| Sample: |
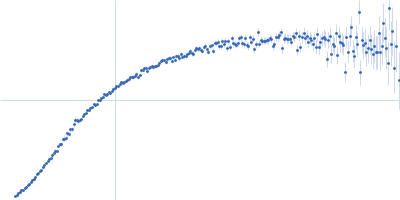
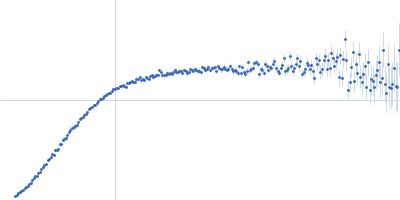
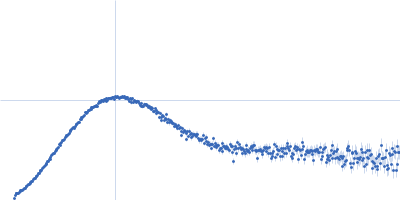
Poly-adenosine monomer, 10 kDa RNA
|
| Buffer: |
1 mM Na-MOPS, 20 mM NaCl, 5 mM MgCl2, 20µM EDTA, pH: 7 |
| Experiment: |
SAXS
data collected at G1, Cornell High Energy Synchrotron Source (CHESS) on 2015 Oct 24
|
Visualizing disordered single-stranded RNA: connecting sequence, structure and electrostatics.
J Am Chem Soc (2019)
Plumridge A, Andresen K, Pollack L
|
| RgGuinier |
2.3 |
nm |
| Dmax |
10.0 |
nm |
| VolumePorod |
15 |
nm3 |
|
|
|
|
|
|
|
| Sample: |
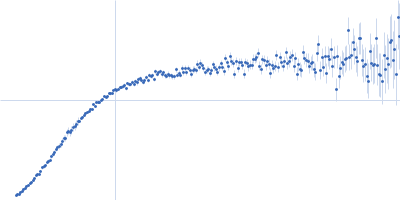
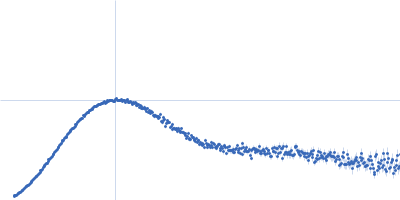
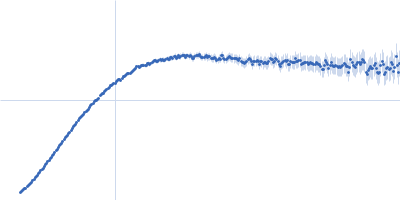
Poly-uridine monomer, 9 kDa RNA
|
| Buffer: |
1 mM Na-MOPS, 400 mM NaCl, 20 µM EDTA, pH: 7 |
| Experiment: |
SAXS
data collected at G1, Cornell High Energy Synchrotron Source (CHESS) on 2015 Oct 25
|
Visualizing disordered single-stranded RNA: connecting sequence, structure and electrostatics.
J Am Chem Soc (2019)
Plumridge A, Andresen K, Pollack L
|
| RgGuinier |
2.3 |
nm |
| Dmax |
10.5 |
nm |
| VolumePorod |
14 |
nm3 |
|
|
|
|
|
|
|
| Sample: |
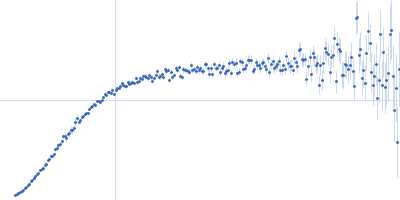
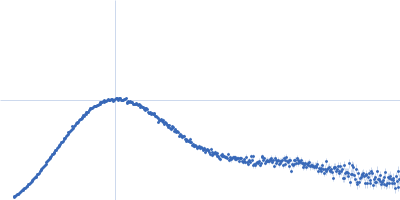
Poly-uridine monomer, 9 kDa RNA
|
| Buffer: |
1 mM Na-MOPS, 600 mM NaCl, 20 µM EDTA, pH: 7 |
| Experiment: |
SAXS
data collected at G1, Cornell High Energy Synchrotron Source (CHESS) on 2015 Oct 25
|
Visualizing disordered single-stranded RNA: connecting sequence, structure and electrostatics.
J Am Chem Soc (2019)
Plumridge A, Andresen K, Pollack L
|
| RgGuinier |
2.3 |
nm |
| Dmax |
10.0 |
nm |
| VolumePorod |
14 |
nm3 |
|
|
|
|
|
|
|
| Sample: |
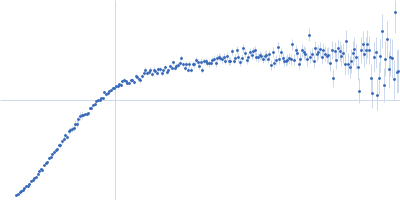
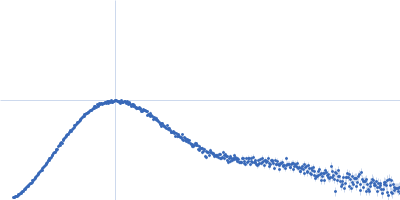
Poly-uridine monomer, 9 kDa RNA
|
| Buffer: |
1 mM Na-MOPS, 20 mM NaCl, 5 mM MgCl2, 20 µM EDTA, pH: 7 |
| Experiment: |
SAXS
data collected at G1, Cornell High Energy Synchrotron Source (CHESS) on 2015 Oct 24
|
Visualizing disordered single-stranded RNA: connecting sequence, structure and electrostatics.
J Am Chem Soc (2019)
Plumridge A, Andresen K, Pollack L
|
| RgGuinier |
2.5 |
nm |
| Dmax |
10.0 |
nm |
| VolumePorod |
15 |
nm3 |
|
|
|
|
|
|
|
| Sample: |
Poly-uridine monomer, 9 kDa RNA
|
| Buffer: |
1 mM Na-MOPS, 20 mM NaCl, 10 mM MgCl2, 20 µM EDTA, pH: 7 |
| Experiment: |
SAXS
data collected at G1, Cornell High Energy Synchrotron Source (CHESS) on 2015 Oct 24
|
Visualizing disordered single-stranded RNA: connecting sequence, structure and electrostatics.
J Am Chem Soc (2019)
Plumridge A, Andresen K, Pollack L
|
| RgGuinier |
2.3 |
nm |
| Dmax |
9.5 |
nm |
| VolumePorod |
14 |
nm3 |
|
|
|
|
|
|
|
| Sample: |
Endoribonuclease E tetramer, 248 kDa Yersinia pestis protein
|
| Buffer: |
10 mM DTT, 10 mM MgCl2, 0.5 M NaCl, 20 mM Tris, pH: 8 |
| Experiment: |
SAXS
data collected at B21, Diamond Light Source on 2017 Feb 11
|
A structural and biochemical comparison of Ribonuclease E homologues from pathogenic bacteria highlights species-specific properties.
Sci Rep 9(1):7952 (2019)
Mardle CE, Shakespeare TJ, Butt LE, Goddard LR, Gowers DM, Atkins HS, Vincent HA, Callaghan AJ
|
| RgGuinier |
5.1 |
nm |
| Dmax |
16.4 |
nm |
| VolumePorod |
470 |
nm3 |
|
|
|
|
|
|
|
| Sample: |
Endoribonuclease E tetramer, 256 kDa Francisella tularensis protein
|
| Buffer: |
10 mM DTT, 10 mM MgCl2, 0.5 M NaCl, 20 mM Tris, pH: 8 |
| Experiment: |
SAXS
data collected at B21, Diamond Light Source on 2017 Feb 11
|
A structural and biochemical comparison of Ribonuclease E homologues from pathogenic bacteria highlights species-specific properties.
Sci Rep 9(1):7952 (2019)
Mardle CE, Shakespeare TJ, Butt LE, Goddard LR, Gowers DM, Atkins HS, Vincent HA, Callaghan AJ
|
| RgGuinier |
5.1 |
nm |
| Dmax |
17.2 |
nm |
| VolumePorod |
491 |
nm3 |
|
|
|
|
|
|
|
| Sample: |
Endoribonuclease E tetramer, 250 kDa Burkholderia pseudomallei protein
|
| Buffer: |
10 mM DTT, 10 mM MgCl2, 0.5 M NaCl, 20 mM Tris, pH: 8 |
| Experiment: |
SAXS
data collected at B21, Diamond Light Source on 2017 Feb 11
|
A structural and biochemical comparison of Ribonuclease E homologues from pathogenic bacteria highlights species-specific properties.
Sci Rep 9(1):7952 (2019)
Mardle CE, Shakespeare TJ, Butt LE, Goddard LR, Gowers DM, Atkins HS, Vincent HA, Callaghan AJ
|
| RgGuinier |
4.8 |
nm |
| Dmax |
14.9 |
nm |
| VolumePorod |
437 |
nm3 |
|
|
|
|
|
|
|
| Sample: |
Endoribonuclease E tetramer, 254 kDa Acinetobacter baumannii protein
|
| Buffer: |
10 mM DTT, 10 mM MgCl2, 0.5 M NaCl, 20 mM Tris, pH: 8 |
| Experiment: |
SAXS
data collected at B21, Diamond Light Source on 2017 Feb 11
|
A structural and biochemical comparison of Ribonuclease E homologues from pathogenic bacteria highlights species-specific properties.
Sci Rep 9(1):7952 (2019)
Mardle CE, Shakespeare TJ, Butt LE, Goddard LR, Gowers DM, Atkins HS, Vincent HA, Callaghan AJ
|
| RgGuinier |
5.2 |
nm |
| Dmax |
18.3 |
nm |
| VolumePorod |
508 |
nm3 |
|
|
|
|
|
|
|
| Sample: |
EKC/KEOPS complex subunit GON7 monomer, 13 kDa Homo sapiens protein
|
| Buffer: |
20 mM MES, 200 mM NaCl, 5 mM β-mercaptoethanol, pH: 6.5 |
| Experiment: |
SAXS
data collected at SWING, SOLEIL on 2017 Mar 26
|
Defects in t6A tRNA modification due to GON7 and YRDC mutations lead to Galloway-Mowat syndrome.
Nat Commun 10(1):3967 (2019)
Arrondel C, Missoury S, Snoek R, Patat J, Menara G, Collinet B, Liger D, Durand D, Gribouval O, Boyer O, Buscara L, Martin G, Machuca E, Nevo F, Lescop E, Braun DA, Boschat AC, Sanquer S, Guerrera IC, Revy P, Parisot M, Masson C, Boddaert N, Charbit M, Decramer S, Novo R, Macher MA, Ranchin B, Bacchetta J, Laurent A, Collardeau-Frachon S, van Eerde AM, Hildebrandt F, Magen D, Antignac C, van Tilbeurgh H, Mollet G
|
| RgGuinier |
3.1 |
nm |
| Dmax |
12.5 |
nm |
| VolumePorod |
46 |
nm3 |
|
|