|
|
|
|
|
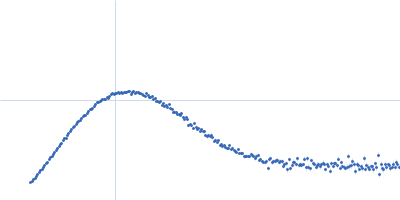
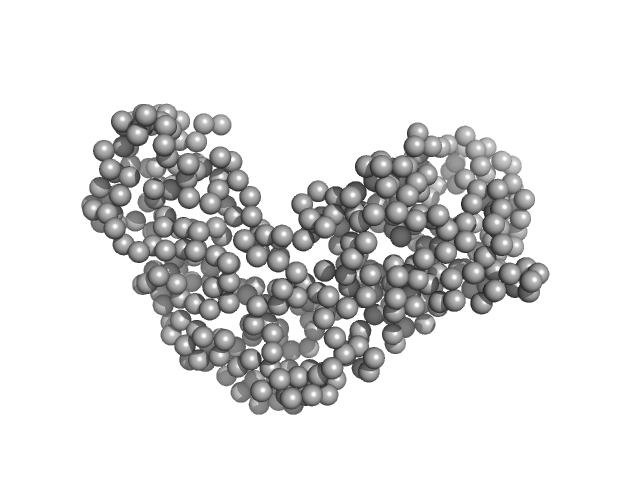
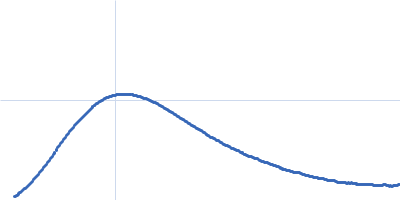
| Sample: |
Thymine dioxygenase JBP1 monomer, 93 kDa Leishmania tarentolae protein
|
| Buffer: |
20 mM HEPES, 200 mM NaCl, 1 mM TCEP, pH: 7.5 |
| Experiment: |
SAXS
data collected at BM29, ESRF on 2016 Feb 21
|
The domain architecture of protozoan protein J-DNA-binding protein 1 suggests synergy between base J DNA binding and thymidine hydroxylase activity.
J Biol Chem (2019)
Adamopoulos A, Heidebrecht T, Roosendaal J, Touw WG, Phan IQ, Beijnen J, Perrakis A
|
| RgGuinier |
3.4 |
nm |
| Dmax |
12.0 |
nm |
| VolumePorod |
128 |
nm3 |
|
|
|
|
|
|
|
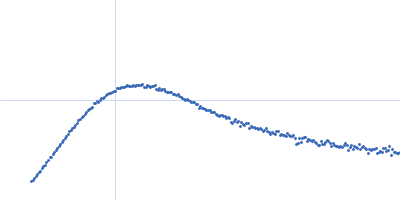
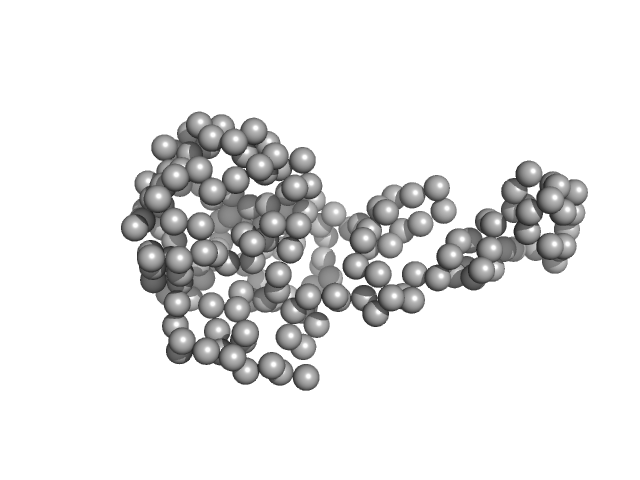
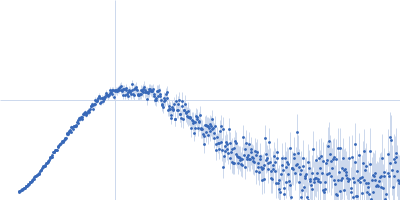
| Sample: |
Delta-JDBD monomer, 72 kDa Leismania tarentolae protein
|
| Buffer: |
20 mM HEPES, 200 mM NaCl, 1 mM TCEP, pH: 7.5 |
| Experiment: |
SAXS
data collected at BM29, ESRF on 2016 Feb 21
|
The domain architecture of protozoan protein J-DNA-binding protein 1 suggests synergy between base J DNA binding and thymidine hydroxylase activity.
J Biol Chem (2019)
Adamopoulos A, Heidebrecht T, Roosendaal J, Touw WG, Phan IQ, Beijnen J, Perrakis A
|
| RgGuinier |
3.1 |
nm |
| Dmax |
9.9 |
nm |
| VolumePorod |
108 |
nm3 |
|
|
|
|
|
|
|
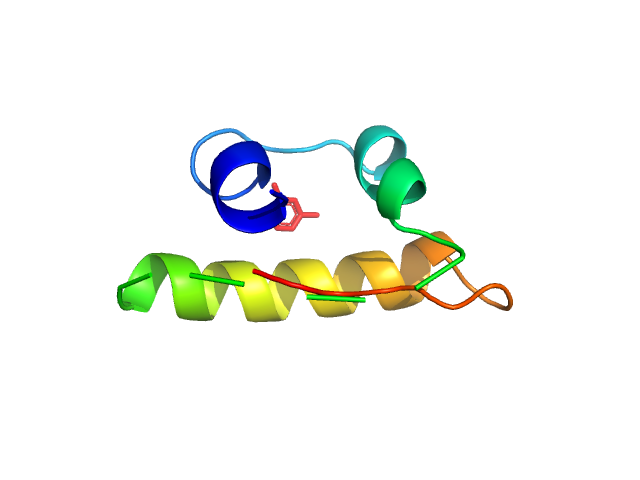
| Sample: |
J-DNA binding domain monomer, 21 kDa Leishmania tarentolae protein
|
| Buffer: |
20 mM HEPES, 200 mM NaCl, 1 mM TCEP, pH: 7.5 |
| Experiment: |
SAXS
data collected at BM29, ESRF on 2017 Feb 4
|
The domain architecture of protozoan protein J-DNA-binding protein 1 suggests synergy between base J DNA binding and thymidine hydroxylase activity.
J Biol Chem (2019)
Adamopoulos A, Heidebrecht T, Roosendaal J, Touw WG, Phan IQ, Beijnen J, Perrakis A
|
| RgGuinier |
2.2 |
nm |
| Dmax |
7.1 |
nm |
| VolumePorod |
38 |
nm3 |
|
|
|
|
|
|
|
| Sample: |
Relaxase (Tra_2) domain of TraI monomer, 46 kDa Neisseria gonorrhoeae protein
|
| Buffer: |
50 mM TRIS-HCl 100 mM NaCl, pH: 8 |
| Experiment: |
SAXS
data collected at BM29, ESRF on 2018 Jul 11
|
DNA processing by the MOBH family relaxase TraI encoded within the gonococcal genetic island.
Nucleic Acids Res 47(15):8136-8153 (2019)
Heilers JH, Reiners J, Heller EM, Golzer A, Smits SHJ, van der Does C
|
| RgGuinier |
2.6 |
nm |
| Dmax |
8.3 |
nm |
| VolumePorod |
61 |
nm3 |
|
|
|
|
|
|
|
| Sample: |
TraI_2_C domain of TraI monomer, 21 kDa Neisseria gonorrhoeae protein
|
| Buffer: |
50 mM TRIS-HCl 100 mM NaCl, pH: 8 |
| Experiment: |
SAXS
data collected at BM29, ESRF on 2018 Jul 11
|
DNA processing by the MOBH family relaxase TraI encoded within the gonococcal genetic island.
Nucleic Acids Res 47(15):8136-8153 (2019)
Heilers JH, Reiners J, Heller EM, Golzer A, Smits SHJ, van der Does C
|
| RgGuinier |
2.2 |
nm |
| Dmax |
6.5 |
nm |
| VolumePorod |
40 |
nm3 |
|
|
|
|
|
|
|
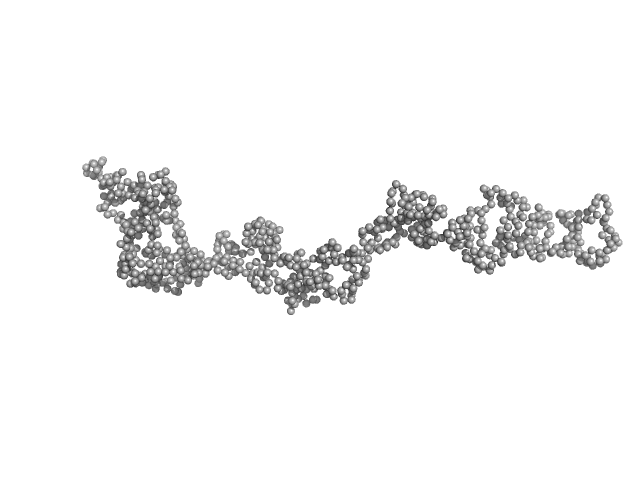
| Sample: |
TraI monomer, 91 kDa Neisseria gonorrhoeae protein
|
| Buffer: |
50 mM TRIS-HCl 100 mM NaCl, pH: 8 |
| Experiment: |
SAXS
data collected at BM29, ESRF on 2018 Mar 5
|
DNA processing by the MOBH family relaxase TraI encoded within the gonococcal genetic island.
Nucleic Acids Res 47(15):8136-8153 (2019)
Heilers JH, Reiners J, Heller EM, Golzer A, Smits SHJ, van der Does C
|
| RgGuinier |
7.3 |
nm |
| Dmax |
31.4 |
nm |
| VolumePorod |
293 |
nm3 |
|
|
|
|
|
|
|
| Sample: |
Human Latent Transforming Growth Factor beta 1 dimer, 86 kDa Homo sapiens protein
|
| Buffer: |
phosphate buffered saline 2% glycerol, pH: 7.4 |
| Experiment: |
SAXS
data collected at 12.3.1 (SIBYLS), Advanced Light Source (ALS) on 2018 Oct 4
|
Structural consequences of transforming growth factor beta-1 activation from near-therapeutic X-ray doses.
J Synchrotron Radiat 26(Pt 4):967-979 (2019)
Stachowski T, Grant TD, Snell EH
|
| RgGuinier |
3.8 |
nm |
| Dmax |
17.5 |
nm |
| VolumePorod |
200 |
nm3 |
|
|
|
|
|
|
|
| Sample: |
Latency Associated Peptide dimer, 58 kDa Homo sapiens protein
|
| Buffer: |
phosphate buffered saline, pH: 7.4 |
| Experiment: |
SAXS
data collected at 12.3.1 (SIBYLS), Advanced Light Source (ALS) on 2018 Oct 4
|
Structural consequences of transforming growth factor beta-1 activation from near-therapeutic X-ray doses.
J Synchrotron Radiat 26(Pt 4):967-979 (2019)
Stachowski T, Grant TD, Snell EH
|
| RgGuinier |
4.1 |
nm |
| Dmax |
17.5 |
nm |
| VolumePorod |
179 |
nm3 |
|
|
|
|
|
|
|
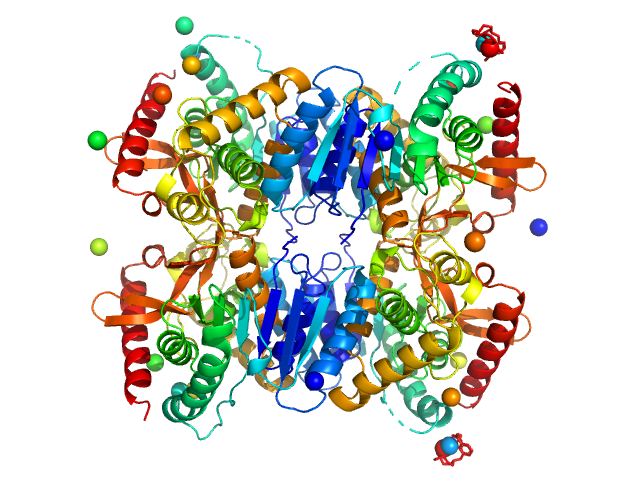
| Sample: |
Malate dehydrogenase tetramer, 134 kDa Ignicoccus islandicus DSM … protein
|
| Buffer: |
50 mM Tris-HCl 50 mM NaCl, pH: 7.4 |
| Experiment: |
SAXS
data collected at BM29, ESRF on 2018 Sep 5
|
The archaeal LDH-like malate dehydrogenase from Ignicoccus islandicus displays dual substrate recognition, hidden allostery and a non-canonical tetrameric oligomeric organization
Journal of Structural Biology (2019)
Roche J, Girard E, Mas C, Madern D
|
| RgGuinier |
3.3 |
nm |
| Dmax |
9.0 |
nm |
| VolumePorod |
198 |
nm3 |
|
|
|
|
|
|
|
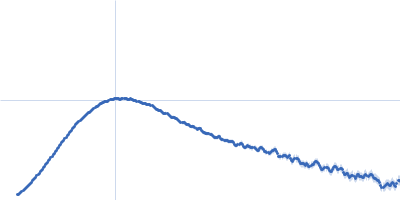
| Sample: |
Insulin glulisine hexamer, 35 kDa protein
|
| Buffer: |
Apidra formulation (per ml: 5 mg Sodium chloride, 3.15 mg m-Cresol, 6 mg Trometamol, 0.01 mg Polysorbate 20), pH: 7.3 |
| Experiment: |
SAXS
data collected at EMBL P12, PETRA III on 2017 Apr 20
|
The quaternary structure of insulin glargine and glulisine under formulation conditions.
Biophys Chem 253:106226 (2019)
Nagel N, Graewert MA, Gao M, Heyse W, Jeffries CM, Svergun D, Berchtold H
|
| RgGuinier |
2.3 |
nm |
| Dmax |
7.6 |
nm |
|
|


 domain of TraI experimental SAS data")