|
|
|
|
|
| Sample: |
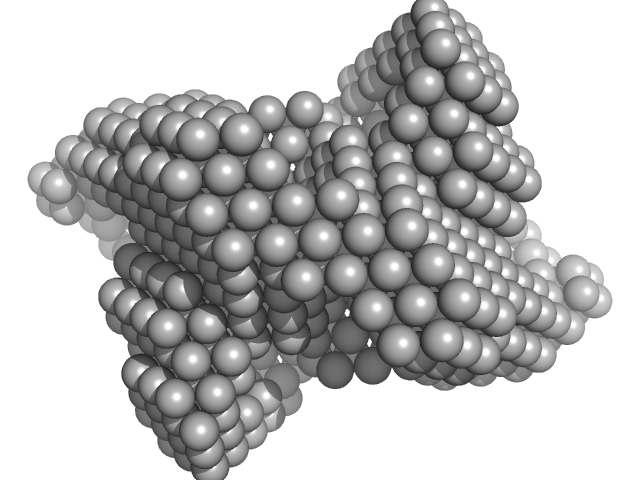
Cysteine desulfurase, putative tetramer, 204 kDa Plasmodium falciparum (isolate … protein
Iron-sulfur cluster assembly protein tetramer, 56 kDa Plasmodium falciparum (isolate … protein
Protein ISD11 tetramer, 43 kDa Plasmodium falciparum (isolate … protein
|
| Buffer: |
50 mM Tris-Cl, 300 mM NaCl, 5% Glycerol, pH: 7.5
|
| Experiment: |
SAXS
data collected at Anton Paar SAXSpace, CSIR-Central Drug Research Institute on 2019 Sep 19
|
[Fe-S] cluster biogenesis and unusual assembly of the ISC scaffold complex in Plasmodium falciparum mitochondrion
Ravishankar Ramachandran
|
| RgGuinier |
7.1 |
nm |
| Dmax |
17.9 |
nm |
| VolumePorod |
950 |
nm3 |
|
|
|
|
|
|
|
| Sample: |
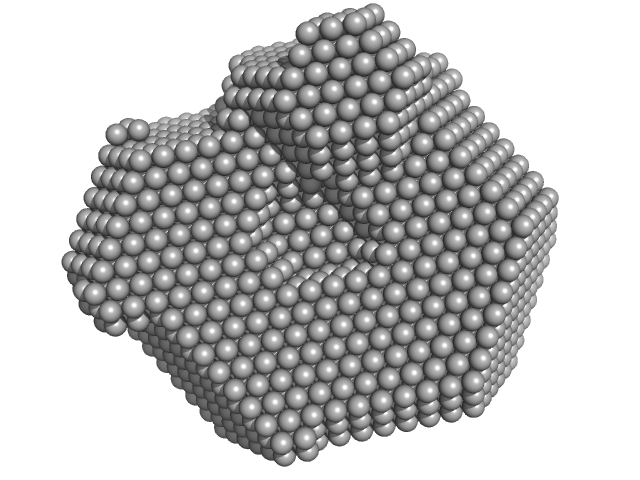
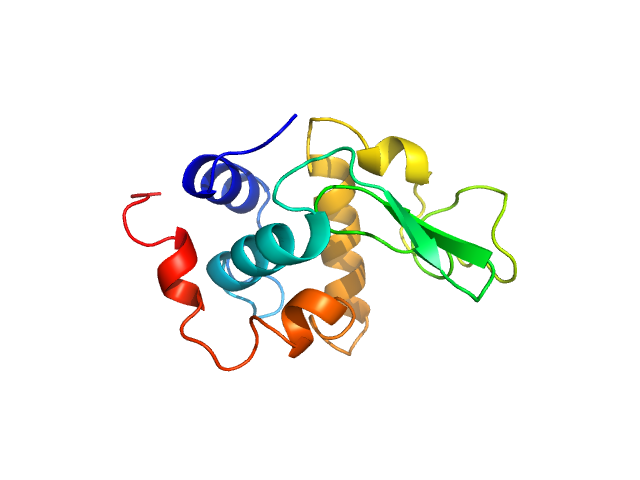
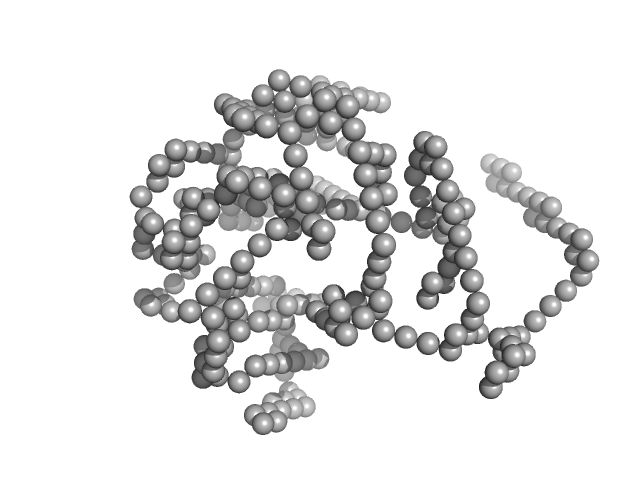
Lysozyme C monomer, 14 kDa Gallus gallus protein
|
| Buffer: |
40 mM NaOAc pH 3.8, 150 mM NaCl, pH: 3.8
|
| Experiment: |
SAXS
data collected at X9A, National Synchrotron Light Source (NSLS) on 2014 May 2
|
Visualizing how inclusion of higher reciprocal space in SWAXS data analysis improves shape restoration of biomolecules: case of lysozyme.
J Biomol Struct Dyn :1-15 (2021)
Ashish
|
| RgGuinier |
1.4 |
nm |
| Dmax |
4.2 |
nm |
|
|
|
|
|
|

|
| Sample: |
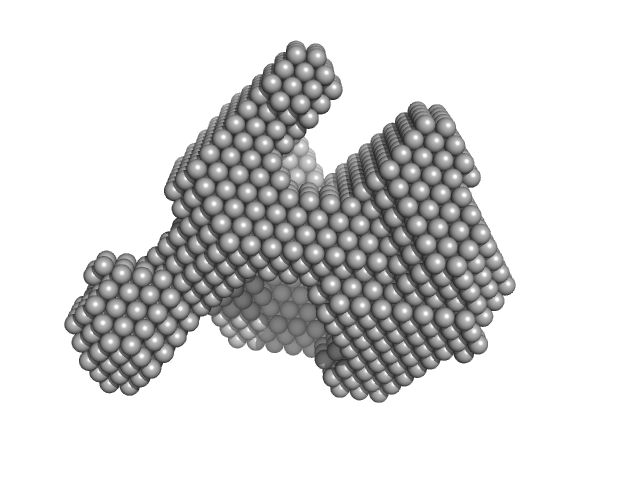
Lysozyme C monomer, 14 kDa Gallus gallus protein
|
| Buffer: |
40 mM NaOAc pH 3.8, 150 mM NaCl, pH: 3.8
|
| Experiment: |
SAXS
data collected at X9A, National Synchrotron Light Source (NSLS) on 2014 May 2
|
Visualizing how inclusion of higher reciprocal space in SWAXS data analysis improves shape restoration of biomolecules: case of lysozyme.
J Biomol Struct Dyn :1-15 (2021)
Ashish
|
| RgGuinier |
1.3 |
nm |
| Dmax |
4.2 |
nm |
|
|
|
|
|
|
|
| Sample: |
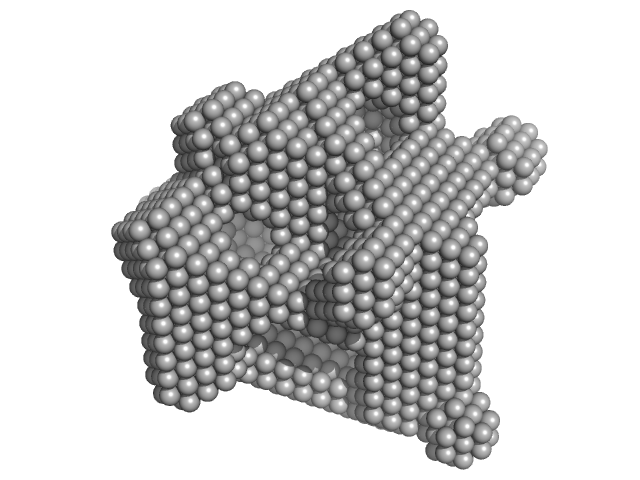
Lysozyme C monomer, 14 kDa Gallus gallus protein
|
| Buffer: |
40 mM NaOAc pH 3.8, 150 mM NaCl, pH: 3.8
|
| Experiment: |
SAXS
data collected at X9A, National Synchrotron Light Source (NSLS) on 2014 May 2
|
Visualizing how inclusion of higher reciprocal space in SWAXS data analysis improves shape restoration of biomolecules: case of lysozyme.
J Biomol Struct Dyn :1-15 (2021)
Ashish
|
| RgGuinier |
1.4 |
nm |
| Dmax |
4.2 |
nm |
|
|
|
|
|
|

|
| Sample: |
Lysozyme C monomer, 14 kDa Gallus gallus protein
|
| Buffer: |
40 mM NaOAc pH 3.8, 150 mM NaCl, pH: 3.8
|
| Experiment: |
SAXS
data collected at X9A, National Synchrotron Light Source (NSLS) on 2014 May 2
|
Visualizing how inclusion of higher reciprocal space in SWAXS data analysis improves shape restoration of biomolecules: case of lysozyme.
J Biomol Struct Dyn :1-15 (2021)
Ashish
|
| RgGuinier |
1.4 |
nm |
| Dmax |
4.3 |
nm |
|
|
|
|
|
|
|
| Sample: |
Lysozyme C monomer, 14 kDa Gallus gallus protein
|
| Buffer: |
40 mM NaOAc pH 3.8, 150 mM NaCl, pH: 3.8
|
| Experiment: |
SAXS
data collected at X9A, National Synchrotron Light Source (NSLS) on 2014 May 2
|
Visualizing how inclusion of higher reciprocal space in SWAXS data analysis improves shape restoration of biomolecules: case of lysozyme.
J Biomol Struct Dyn :1-15 (2021)
Ashish
|
| RgGuinier |
1.4 |
nm |
| Dmax |
4.2 |
nm |
|
|
|
|
|
|
|
| Sample: |
Lysozyme C monomer, 14 kDa Gallus gallus protein
|
| Buffer: |
40 mM NaOAc pH 3.8, 150 mM NaCl, pH: 3.8
|
| Experiment: |
SAXS
data collected at X9A, National Synchrotron Light Source (NSLS) on 2014 May 2
|
Visualizing how inclusion of higher reciprocal space in SWAXS data analysis improves shape restoration of biomolecules: case of lysozyme.
J Biomol Struct Dyn :1-15 (2021)
Ashish
|
| RgGuinier |
1.4 |
nm |
| Dmax |
4.5 |
nm |
|
|
|
|
|
|
|
| Sample: |
Lysozyme C monomer, 14 kDa Gallus gallus protein
|
| Buffer: |
40 mM NaOAc pH 3.8, 150 mM NaCl, pH: 3.8
|
| Experiment: |
SAXS
data collected at X9A, National Synchrotron Light Source (NSLS) on 2014 May 2
|
Visualizing how inclusion of higher reciprocal space in SWAXS data analysis improves shape restoration of biomolecules: case of lysozyme.
J Biomol Struct Dyn :1-15 (2021)
Ashish
|
| RgGuinier |
1.4 |
nm |
| Dmax |
4.2 |
nm |
|
|
|
|
|
|

|
| Sample: |
Lysozyme C monomer, 14 kDa Gallus gallus protein
|
| Buffer: |
40 mM NaOAc pH 3.8, 150 mM NaCl, pH: 3.8
|
| Experiment: |
SAXS
data collected at X9A, National Synchrotron Light Source (NSLS) on 2014 May 2
|
Visualizing how inclusion of higher reciprocal space in SWAXS data analysis improves shape restoration of biomolecules: case of lysozyme.
J Biomol Struct Dyn :1-15 (2021)
Ashish
|
| RgGuinier |
1.4 |
nm |
| Dmax |
5.0 |
nm |
|
|
|
|
|
|

|
| Sample: |
Lysozyme C monomer, 14 kDa Gallus gallus protein
|
| Buffer: |
40 mM NaOAc pH 3.8, 150 mM NaCl, pH: 3.8
|
| Experiment: |
SAXS
data collected at X9A, National Synchrotron Light Source (NSLS) on 2014 May 2
|
Visualizing how inclusion of higher reciprocal space in SWAXS data analysis improves shape restoration of biomolecules: case of lysozyme.
J Biomol Struct Dyn :1-15 (2021)
Ashish
|
| RgGuinier |
1.5 |
nm |
| Dmax |
4.6 |
nm |
|
|


