|
|
|
|
|
| Sample: |
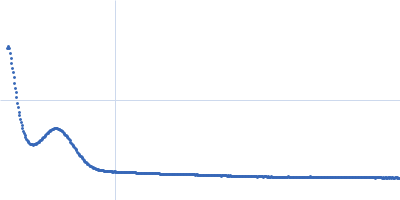
High Five insect cells, 0 kDa Trichoplusia ni
|
| Buffer: |
TBS (20 mM Tris, 150 mM NaCl),, pH: 7 |
| Experiment: |
SAXS
data collected at EMBL P12, PETRA III on 2019 Dec 3
|
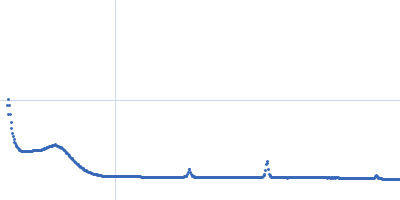
Rapid screening of in cellulo
grown protein crystals via a small-angle X-ray scattering/X-ray powder diffraction synergistic approach
Journal of Applied Crystallography 53(5) (2020)
Lahey-Rudolph J, Schönherr R, Jeffries C, Blanchet C, Boger J, Ferreira Ramos A, Riekehr W, Triandafillidis D, Valmas A, Margiolaki I, Svergun D, Redecke L
|
|
|
|
|
|
|
|
| Sample: |
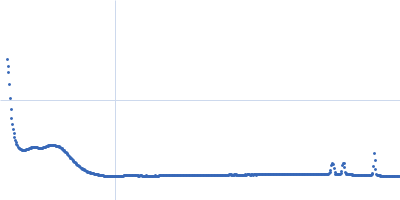
Woronin body major protein, 19 kDa Neurospora crassa protein
|
| Buffer: |
TBS (20 mM Tris, 150 mM NaCl),, pH: 7 |
| Experiment: |
SAXS
data collected at EMBL P12, PETRA III on 2019 Dec 3
|
Rapid screening of in cellulo
grown protein crystals via a small-angle X-ray scattering/X-ray powder diffraction synergistic approach
Journal of Applied Crystallography 53(5) (2020)
Lahey-Rudolph J, Schönherr R, Jeffries C, Blanchet C, Boger J, Ferreira Ramos A, Riekehr W, Triandafillidis D, Valmas A, Margiolaki I, Svergun D, Redecke L
|
|
|
|
|
|
|
|
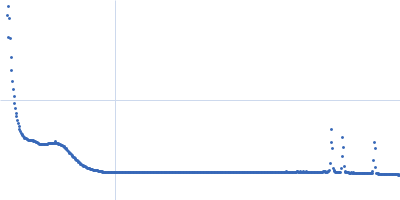
| Sample: |
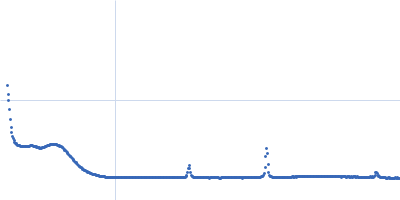
Cathepsin B-like cysteine protease, 37 kDa Trypanosoma brucei protein
|
| Buffer: |
TBS (20 mM Tris, 150 mM NaCl),, pH: 7 |
| Experiment: |
SAXS
data collected at EMBL P12, PETRA III on 2019 Dec 3
|
Rapid screening of in cellulo
grown protein crystals via a small-angle X-ray scattering/X-ray powder diffraction synergistic approach
Journal of Applied Crystallography 53(5) (2020)
Lahey-Rudolph J, Schönherr R, Jeffries C, Blanchet C, Boger J, Ferreira Ramos A, Riekehr W, Triandafillidis D, Valmas A, Margiolaki I, Svergun D, Redecke L
|
|
|
|
|
|
|
|
| Sample: |
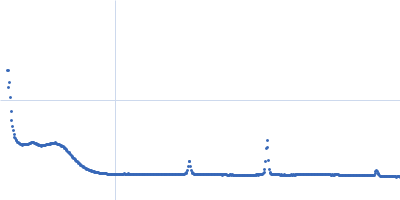
Cathepsin B-like cysteine protease, 37 kDa Trypanosoma brucei protein
|
| Buffer: |
TBS (20 mM Tris, 150 mM NaCl),, pH: 7 |
| Experiment: |
SAXS
data collected at EMBL P12, PETRA III on 2017 Nov 21
|
Rapid screening of in cellulo
grown protein crystals via a small-angle X-ray scattering/X-ray powder diffraction synergistic approach
Journal of Applied Crystallography 53(5) (2020)
Lahey-Rudolph J, Schönherr R, Jeffries C, Blanchet C, Boger J, Ferreira Ramos A, Riekehr W, Triandafillidis D, Valmas A, Margiolaki I, Svergun D, Redecke L
|
|
|
|
|
|
|
|
| Sample: |
Cathepsin B-like cysteine protease, 37 kDa Trypanosoma brucei protein
|
| Buffer: |
TBS (20 mM Tris, 150 mM NaCl),, pH: 7 |
| Experiment: |
SAXS
data collected at EMBL P12, PETRA III on 2017 Nov 21
|
Rapid screening of in cellulo
grown protein crystals via a small-angle X-ray scattering/X-ray powder diffraction synergistic approach
Journal of Applied Crystallography 53(5) (2020)
Lahey-Rudolph J, Schönherr R, Jeffries C, Blanchet C, Boger J, Ferreira Ramos A, Riekehr W, Triandafillidis D, Valmas A, Margiolaki I, Svergun D, Redecke L
|
|
|
|
|
|
|
|
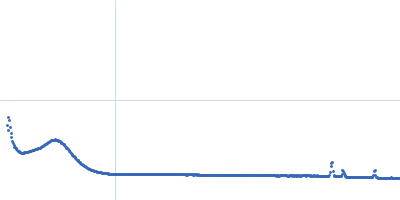
| Sample: |
Woronin body major protein, 19 kDa Neurospora crassa protein
|
| Buffer: |
TBS (20 mM Tris, 150 mM NaCl),, pH: 7 |
| Experiment: |
SAXS
data collected at EMBL P12, PETRA III on 2017 Nov 21
|
Rapid screening of in cellulo
grown protein crystals via a small-angle X-ray scattering/X-ray powder diffraction synergistic approach
Journal of Applied Crystallography 53(5) (2020)
Lahey-Rudolph J, Schönherr R, Jeffries C, Blanchet C, Boger J, Ferreira Ramos A, Riekehr W, Triandafillidis D, Valmas A, Margiolaki I, Svergun D, Redecke L
|
|
|
|
|
|
|
|
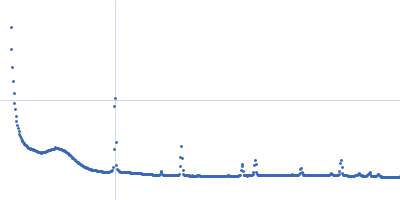
| Sample: |
Inosine-5'-monophosphate dehydrogenase, 59 kDa Trypanosoma brucei brucei protein
|
| Buffer: |
20 mM Tris, 150 mM NaCl,, pH: 7 |
| Experiment: |
SAXS
data collected at EMBL P12, PETRA III on 2017 Nov 21
|
Rapid screening of in cellulo
grown protein crystals via a small-angle X-ray scattering/X-ray powder diffraction synergistic approach
Journal of Applied Crystallography 53(5) (2020)
Lahey-Rudolph J, Schönherr R, Jeffries C, Blanchet C, Boger J, Ferreira Ramos A, Riekehr W, Triandafillidis D, Valmas A, Margiolaki I, Svergun D, Redecke L
|
|
|
|
|
|
|
|
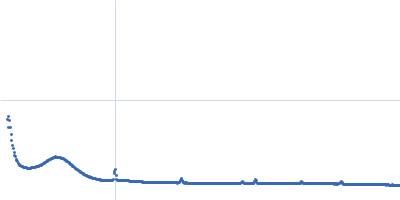
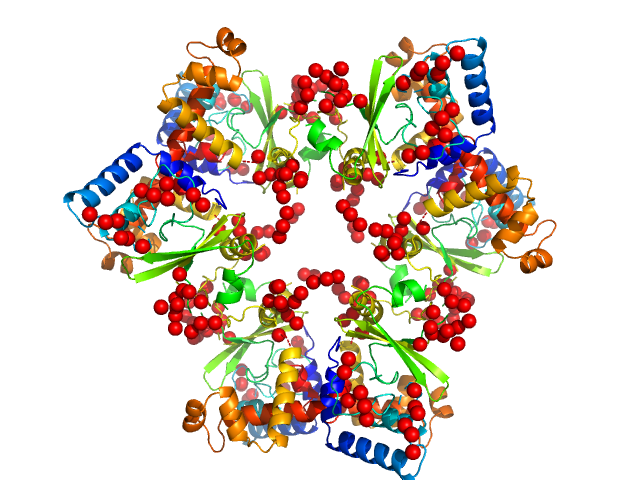
| Sample: |
Regulator Of Virulence interconnected with the Csr system hexamer, 175 kDa Yersinia pseudotuberculosis protein
|
| Buffer: |
50 mM TRIS pH= 8, 500 mM NaCl, 5 mM DTT, 5 % v/v glycerol, pH: 8 |
| Experiment: |
SAXS
data collected at EMBL P12, PETRA III on 2016 Jun 18
|
RovC - a novel type of hexameric transcriptional activator promoting type VI secretion gene expression
PLOS Pathogens 16(9):e1008552 (2020)
Knittel V, Sadana P, Seekircher S, Stolle A, Körner B, Volk M, Jeffries C, Svergun D, Heroven A, Scrima A, Dersch P, Mecsas J
|
| RgGuinier |
4.2 |
nm |
| Dmax |
12.4 |
nm |
| VolumePorod |
280 |
nm3 |
|
|